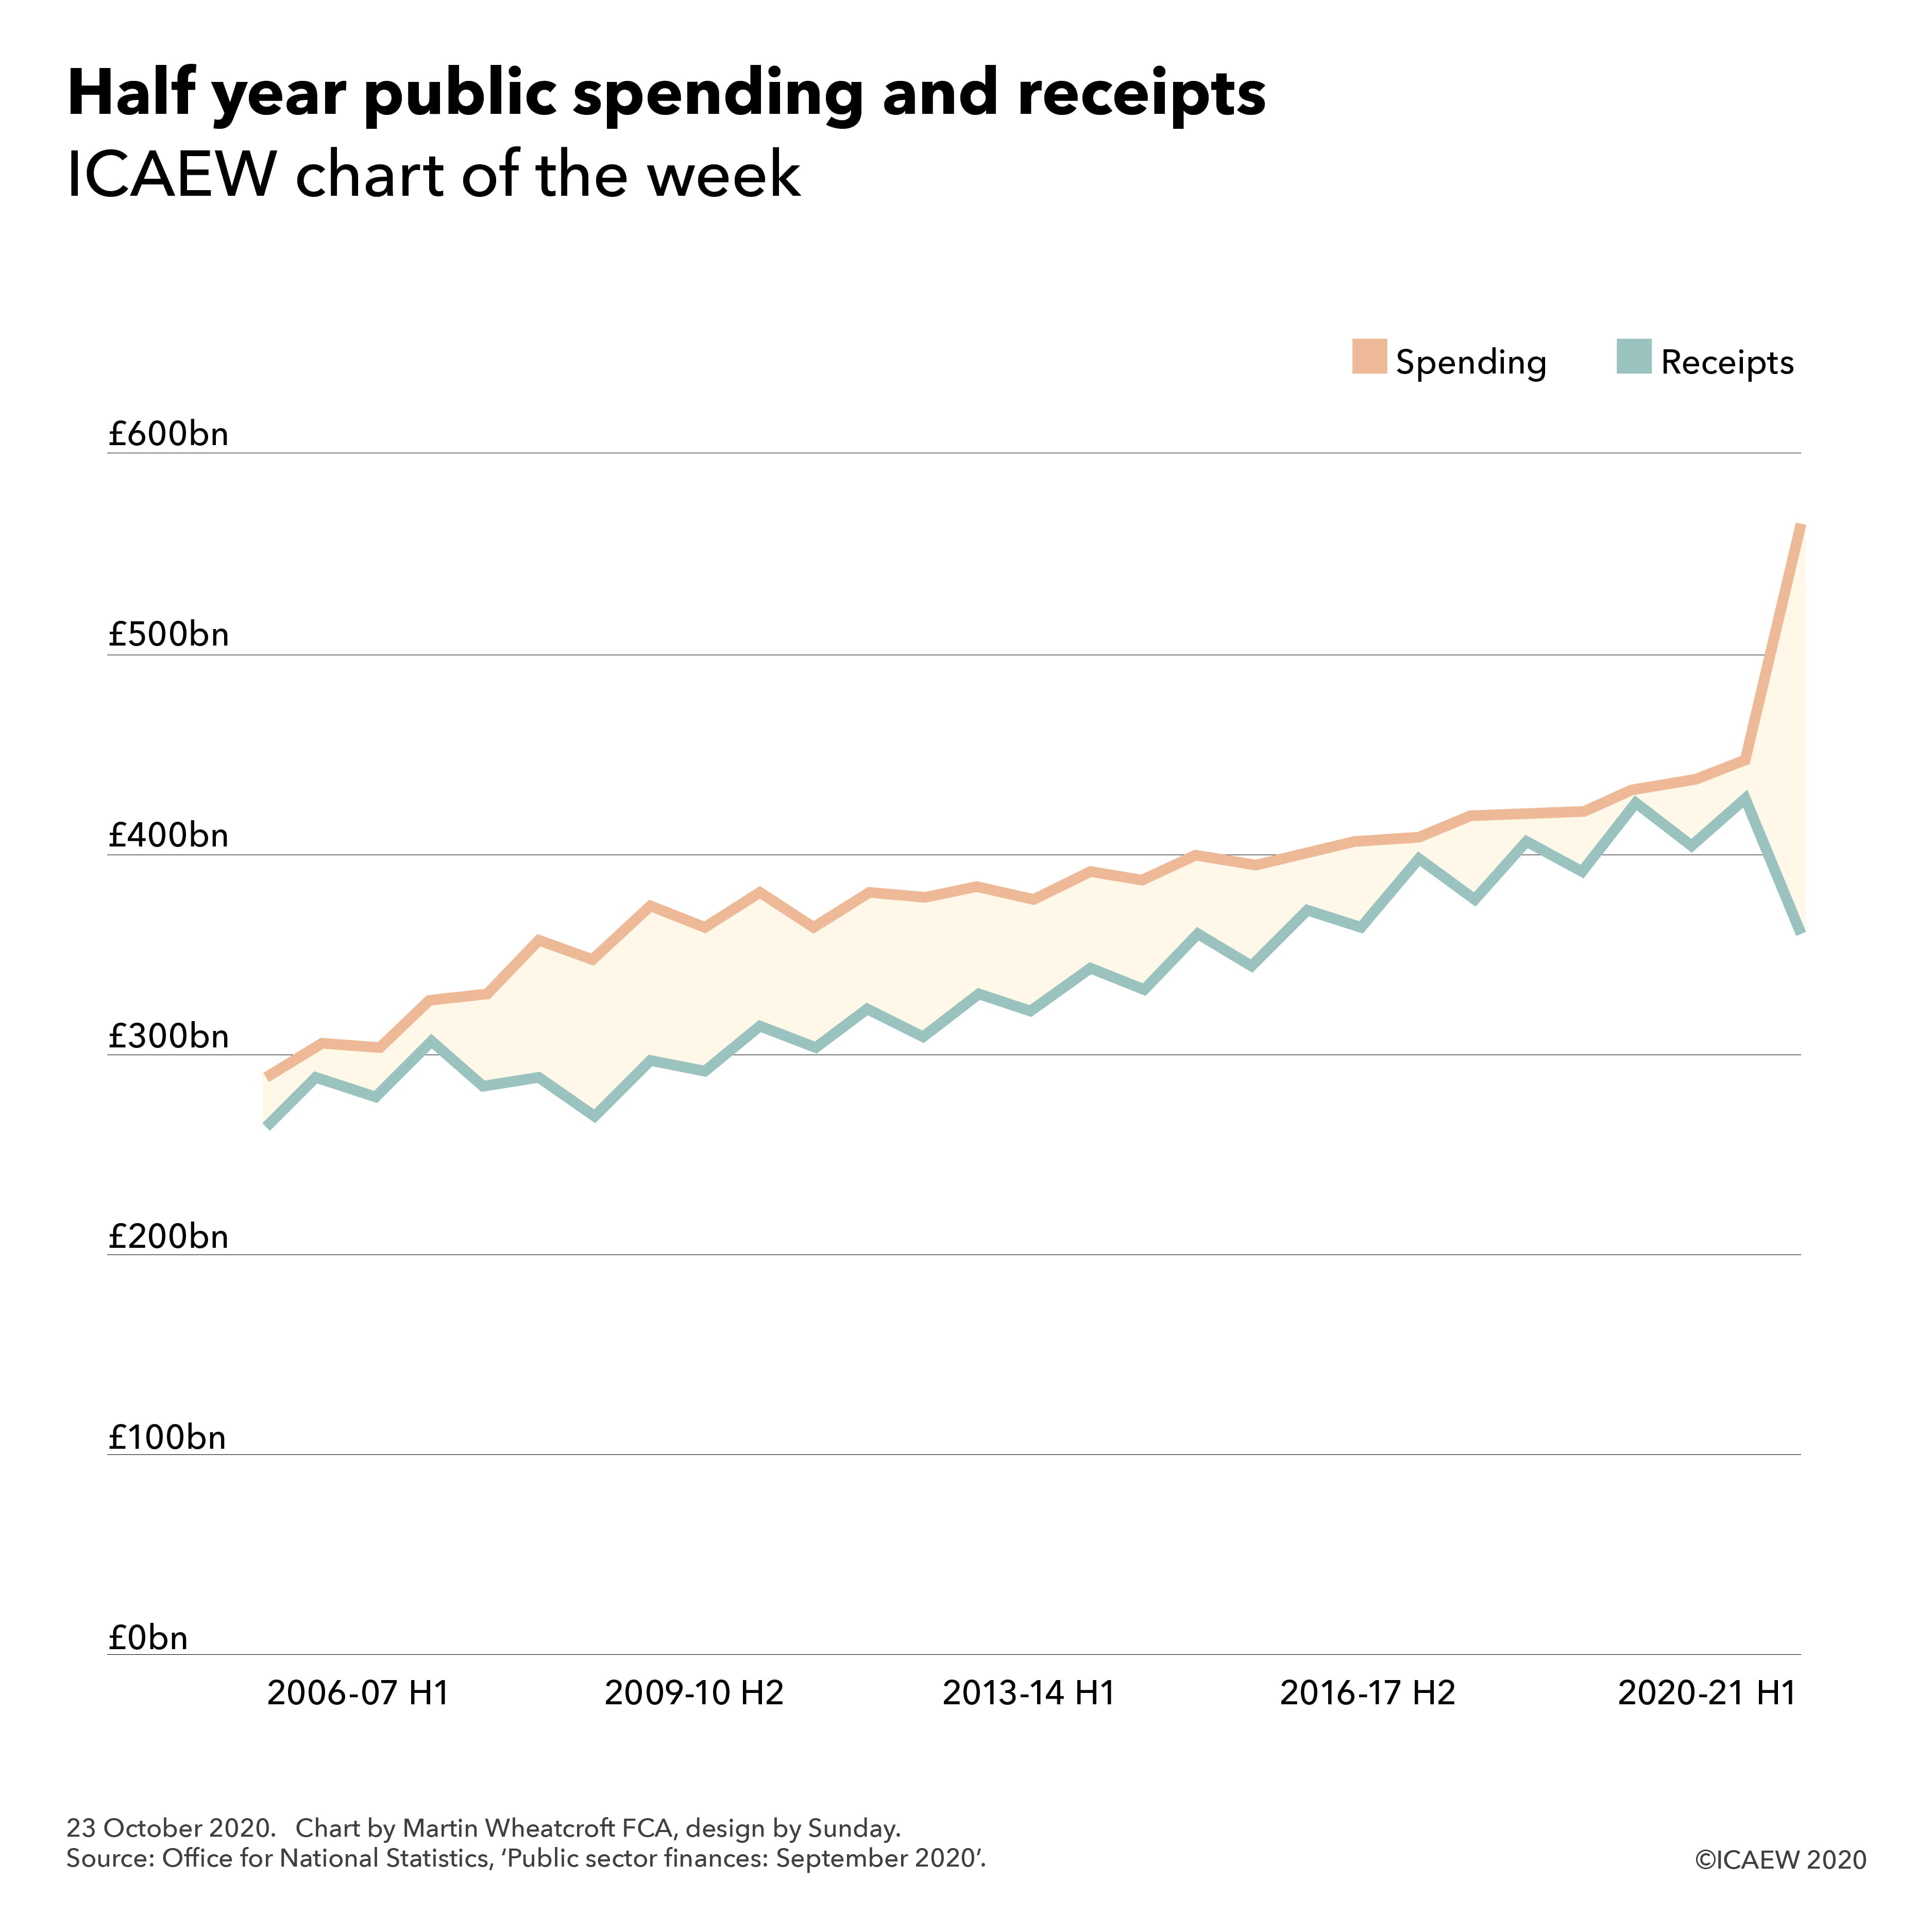
The #icaewchartoftheweek is on UK public spending and receipts in the light of the September 2020 public finance release that reported a fiscal deficit of £208bn for the six months ended 30 September 2020, comprising public spending of £567bn less receipts of £359bn.
The chart illustrates how the shortfall in receipts and public spending of £26bn (public spending £289bn – receipts £263bn) and £14bn (£303bn - £289bn) in the first and second halves of 2006-07 increased to £80bn (£347bn - £267bn) and £78bn (£375bn - £297bn) in 2009-10 before gradually declining to £31bn (£421bn - £390bn) and £8bn (£433bn - £425bn) in the first and second halves of 2018-19 respectively.
The chart highlights how deficits added up over a decade (a cumulative £1.1tn between 1 April 2008 and 31 March 2018) even as the gap between spending and receipts narrowed as well as how much the shortfall has widened in the first half of 2020-21. With a further £140bn or so shortfall expected in the second of the financial year, it will take a strong economic rebound to prevent another trillion of deficits accumulating over the coming decade.
Although the Spending Review in November will now only cover the 2021-22 financial year for current expenditure, it is expected to set capital expenditure budgets for 2022-23 as well. This will be important in giving departments confidence to get infrastructure spending projects underway as quickly as possible next year if there is to be an investment-led economic recovery.