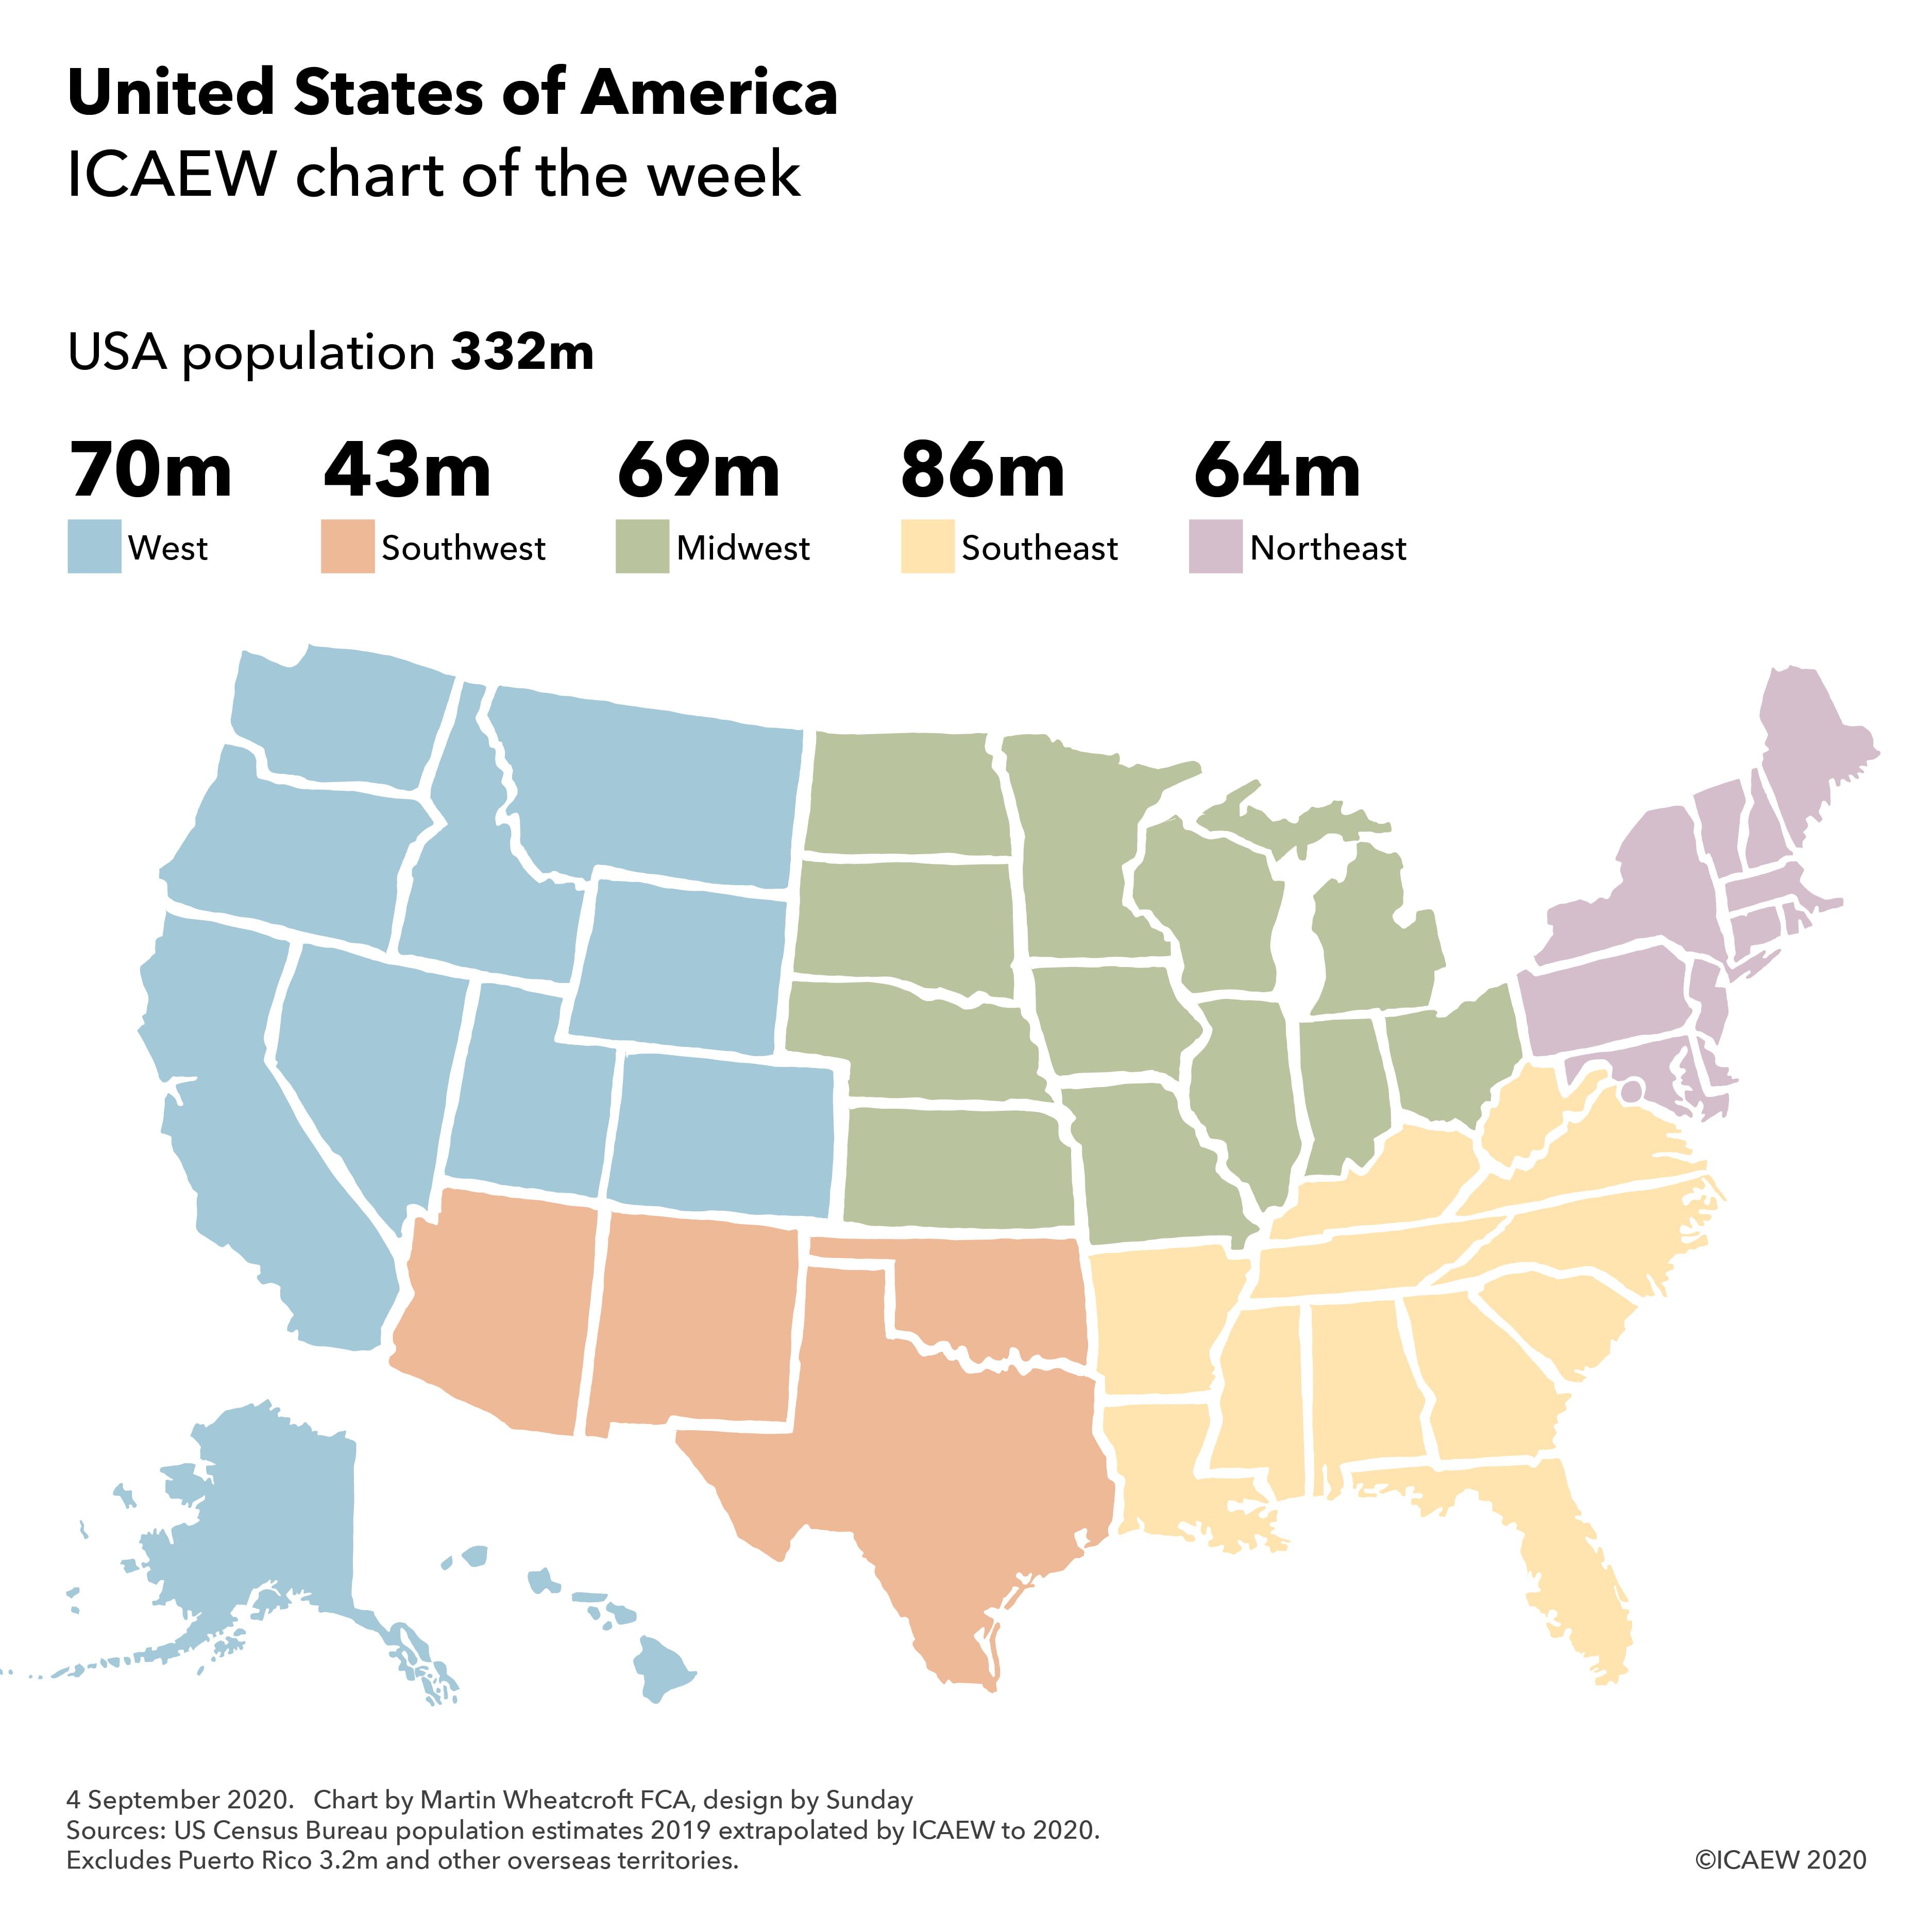
Surprisingly, there is no single official set of regions for the USA, with states classified differently according to which federal agency is responsible for the classification. For example, the US Census Bureau uses four regions (the Northeast, the Midwest, the South and the West), while the Bureau of Economic Analysis allocates the states between eight regions, the Office of Management and Budget uses 10, the federal court system 11, and the Federal Reserve 12.
For the purposes of this particular chart, we have allocated the states based on an unofficial but commonly accepted grouping of states: the West, the Midwest, the Northeast, the Southwest and the Southeast. Unlike the census regions, Delaware, Maryland and Washington DC are included as part of the Northeast, while Arizona and New Mexico (part of the West in some classifications) are combined with Texas and Oklahoma to form the Southwest, with the remaining Southern states constituting the Southeast region.
In terms of population, this gives five regions of which three – the West with 70m, the Midwest with 69m and the Northeast with 64m – are pretty close to the UK’s current population of 67m. The Southeast’s 86m population is almost 30% more than the UK (being closer to Germany’s 84m), while the Southwest’s 43m is around 35% less than the UK’s population (slightly below Spain’s 47m).
Although the UK is around a fifth of the size of the USA in terms of population, it is much much smaller in terms of area, with the USA’s 9.84m square kilometres more than 40 times the UK’s 0.24m square kilometres. That is around eight times as much space per person as for the UK.
| West | 70m | Southwest | 43m | Midwest | 69m | Southeast | 86m | Northeast | 64m |
| California | 39.9m | Texas | 29.5m | Illinois | 12.7m | Florida | 22.0m | New York | 19.4m |
| Washington |
7.8m | Arizona | 7.4m | Ohio | 11.7m | Georgia | 10.7m | Pennsylvania | 12.8m |
| Colorado | 5.8m | Oklahoma | 4.0m | Michigan | 10.0m | North Carolina | 10.6m | New Jersey | 8.9m |
| Oregon |
3.4m | New Mexico | 2.1m | Indiana |
6.7m | Virginia | 8.6m | Massachusetts | 7.0m |
| Utah |
3.3m | Missouri |
6.2m | Tennessee | 6.9m | Maryland | 6.1m | ||
| Nevada | 3.2m | Wisconsin | 5.9m | South Carolina | 5.2m | Connecticut | 3.6m | ||
| Idaho | 1.8m | Minnesota |
5.7m | Alabama | 4.9m | New Hampshire | 1.4m | ||
| Hawaii | 1.4m | Iowa | 3.2m | Louisiana | 4.6m | Maine | 1.3m | ||
| Montana |
1.1m | Kansas | 2.9m | Kentucky | 4.5m | Rhode Island | 1.1m | ||
| Alaska |
0.7m | Nebraska |
2.0m | Arkansas | 3.0m | Delaware | 1.0m | ||
| Wyoming | 0.6m | South Dakota | 0.9m | Mississippi | 3.0m | Washington DC | 0.7m | ||
| North Dakota |
0.8m | West Virginia | 1.8m | Vermont | 0.6m | ||||
Excludes Puerto Rico 3.2m and other overseas territories.
Join the Public Sector Community
For accountants and finance professionals working in and advising the public sector, this Community is the go-to for the key resources and guidance on the issues affecting practitioners like you. With a range of dynamic services, we provide valuable tools, resources and support tailored specifically to your sector.
