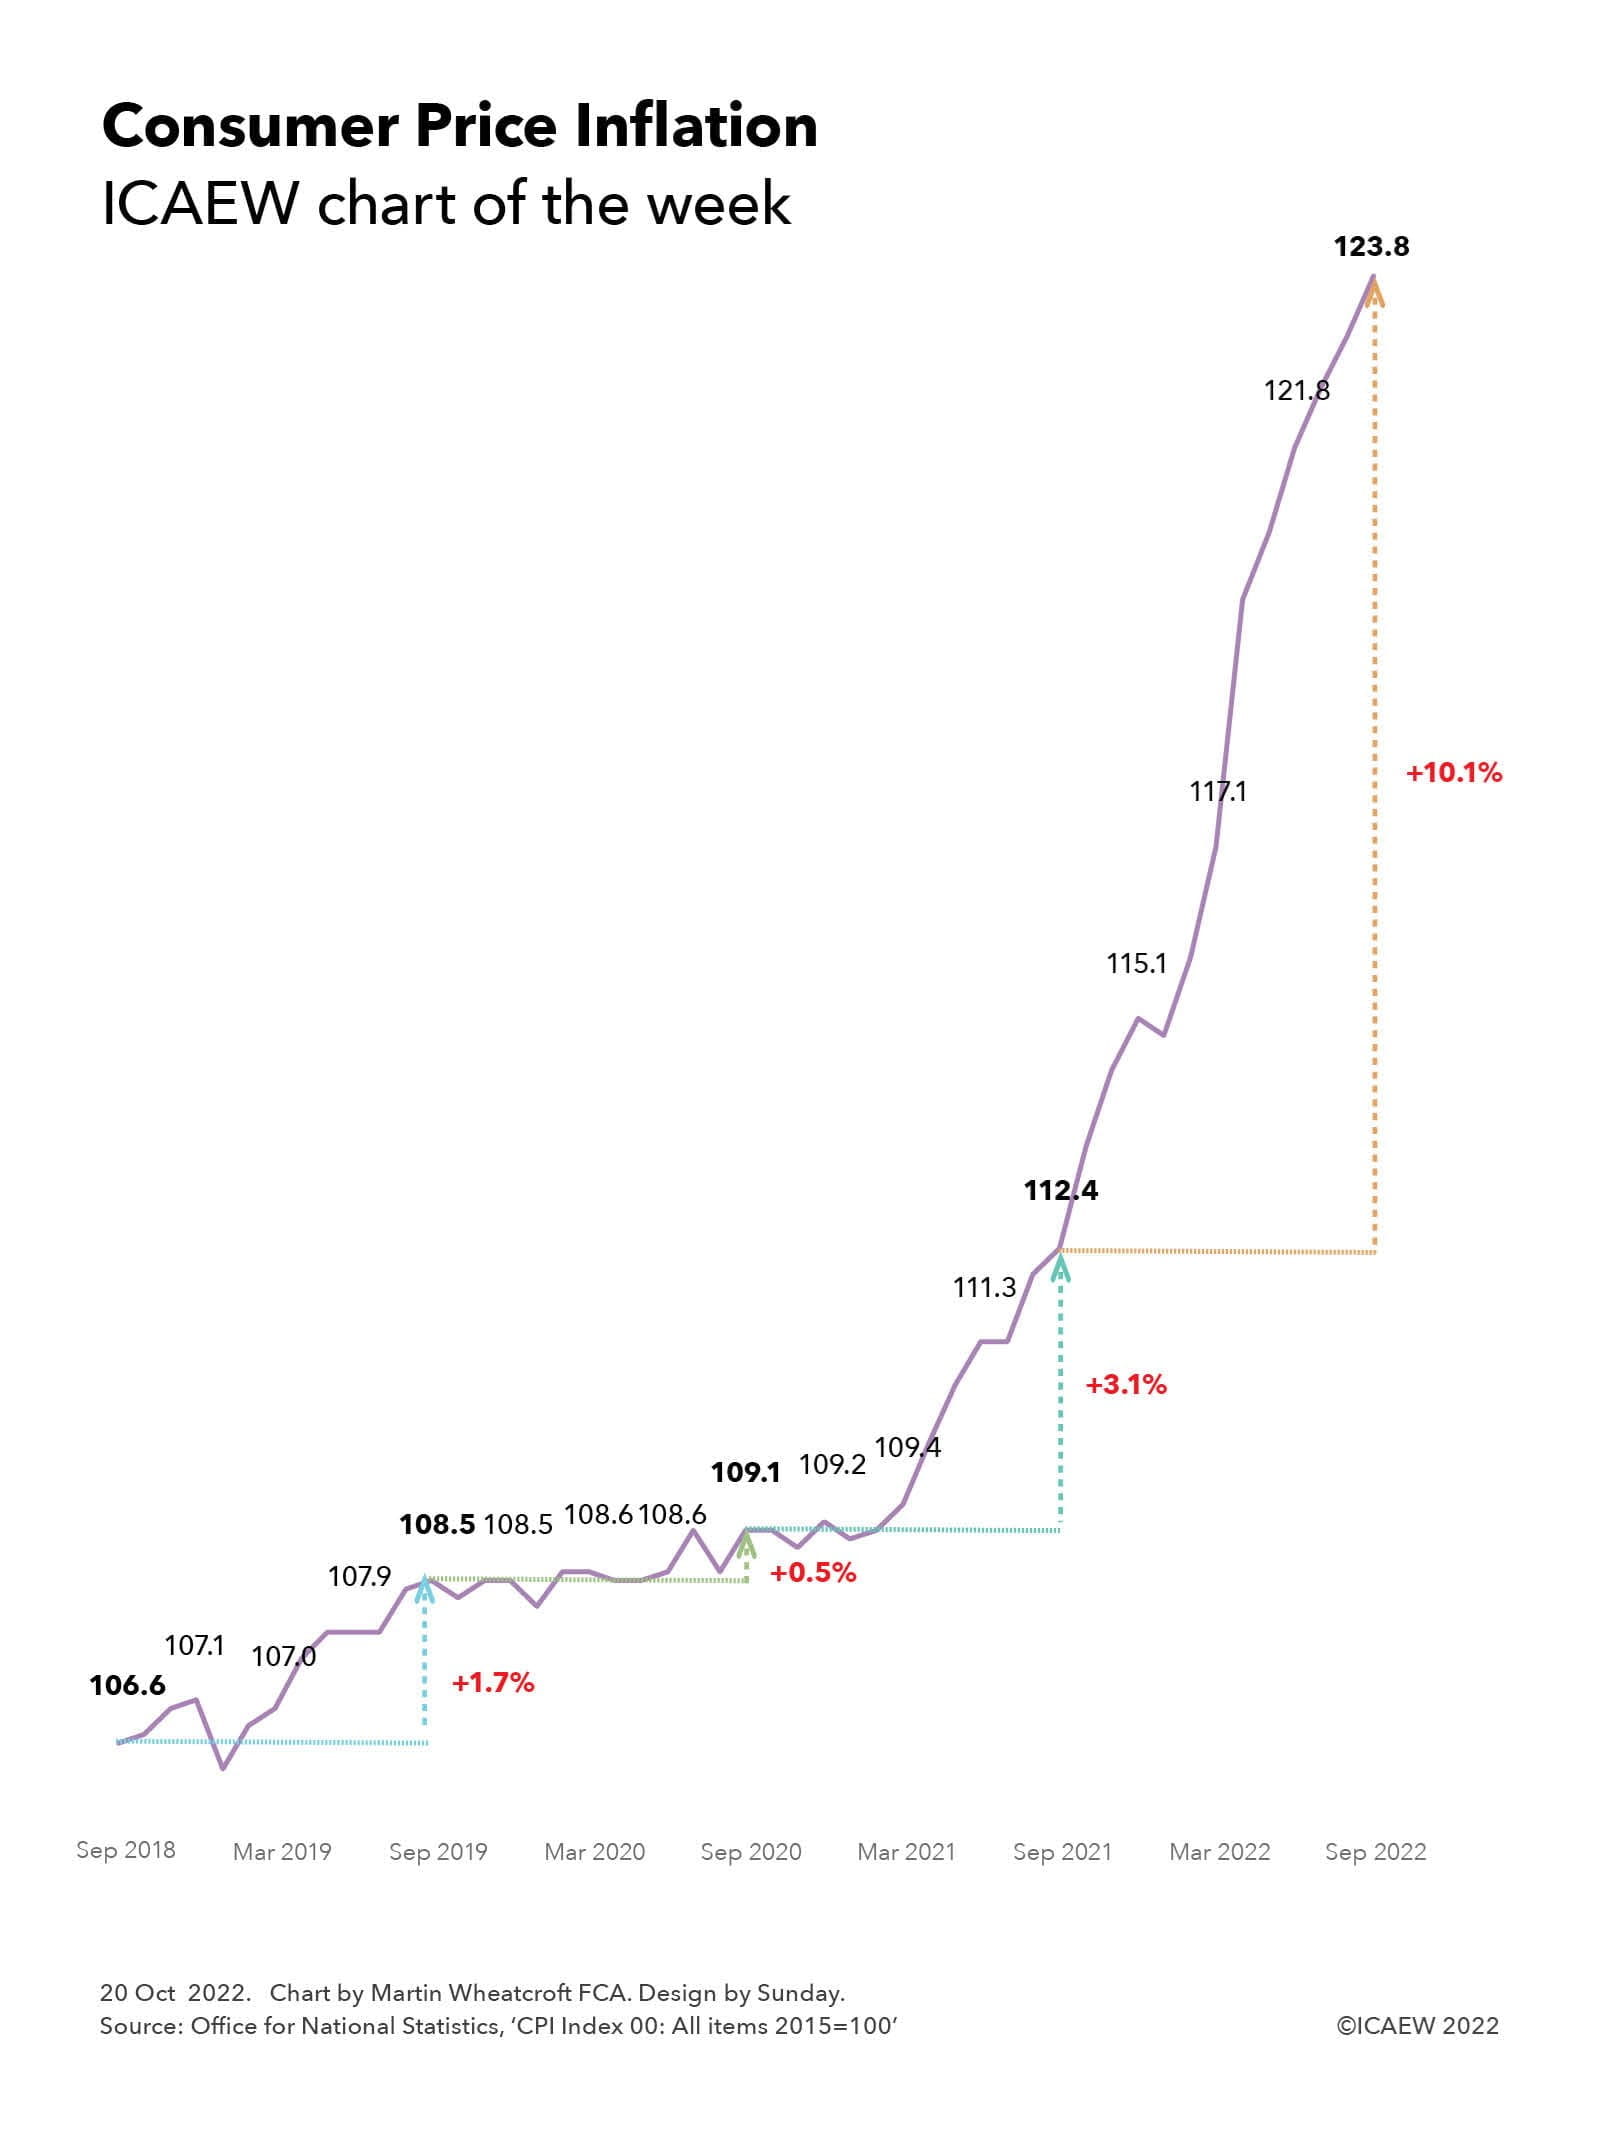
The ICAEW chart of the week is on consumer price inflation, illustrating how the CPI index rose from 106.1 in September 2018 to 108.5 in September 2019, 109.1 in September 2020, 112.4 in September 2021 and 123.8 in September 2022. According to the Office for National Statistics (ONS), this meant that annual consumer price inflation was 1.7%, 0.5%, 3.1% and 10.1% for each of the four years to September 2022.
The percentage increase in the consumer price inflation index to each September is an important number as it is used to uprate most welfare benefits from the following April. In addition, under the triple-lock formula that has just been recommitted to by the government, it will be used to uprate the state pension in place of the statutory requirement for a rise in line with average earnings, which in September 2022 was 5.5%.
There has been speculation that the Chancellor of the Exchequer might try to restrict the uprating of welfare benefits (other than the state pension) to below inflation in order to meet his fiscal objectives. However, there is significant political pressure not to do so during a cost-of-living crisis that means many households are already struggling to pay their bills, even before the large rise in energy prices this month.
In theory, the sharp upward slope in the index over the last year provides some hope for both consumers and the Bank of England, as price increases from a year earlier fall out of the index, at least from November onwards given the energy price guarantee that means domestic energy prices should be flat for the following six months. With petrol and diesel prices appearing to moderate, and the ‘medicine’ of higher interest rates starting to take effect, the hope is that prices will rise less rapidly than they have this year, and so cause the annual rate of inflation to fall in the first half of next year.
Having said that, if recent events have taught us anything it is that our ability to predict the future is far from perfect.


