The Office for National Statistics (ONS) reported that the annual rate of consumer price inflation (CPI) was 10.1% in January 2023, falling from 10.5% last month and down from a peak of 11.1% in October 2022, but much higher than the 5.5% annual rate of inflation for the year to January 2022.
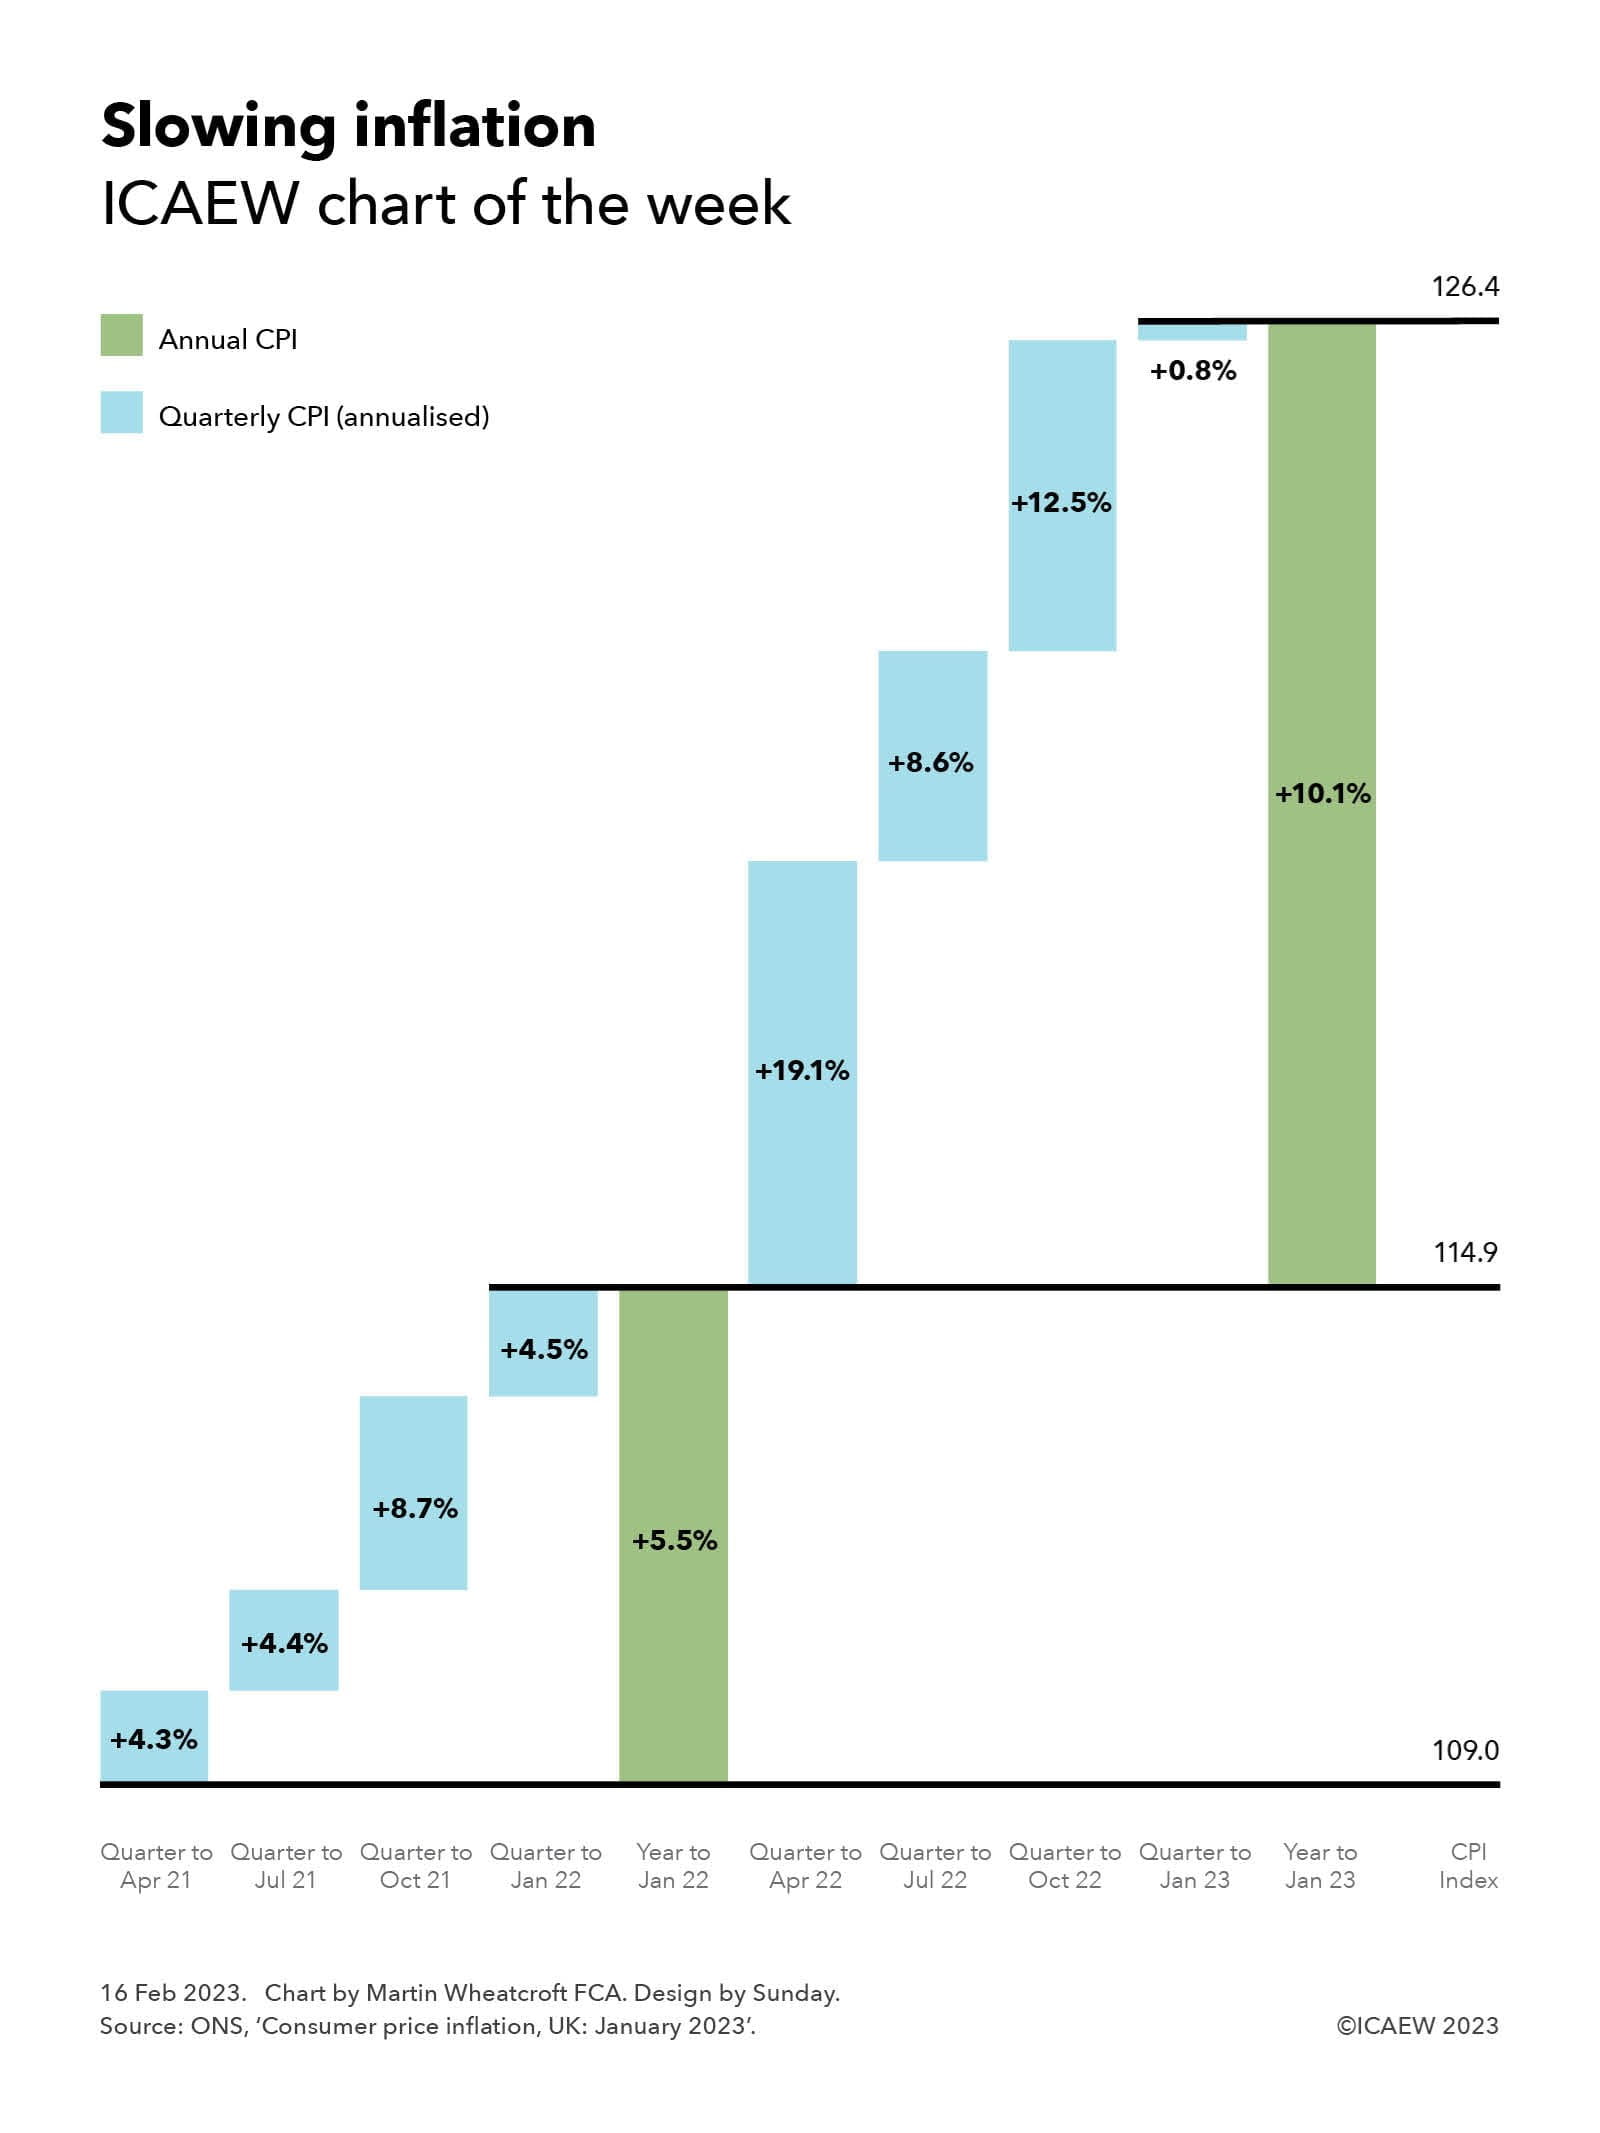
Our chart breaks down annual inflation over the past two years to January 2023 into quarters, highlighting how inflation is likely to fall quite rapidly over the next three months as the big surge in prices following Russia’s invasion of Ukraine last year falls out of the year-on-year comparison.
Reported inflation this time last year was 5.5% for the year to January 2022. This can be broken down into quarterly rises (annualised) of 4.3% in the three months to April 2021, 4.4% in the quarter to July 2021, 8.7% in the quarter to October 2021 and 4.5% in the three months to January 2022. Inflation in that period was well above the Bank of England’s target range of 1% to 3%, as supply constraints drove prices higher as the domestic and global economies started to recover from the depths of the pandemic.
Reported inflation for the year to January 2023 of 10.1% can be broken down into quarterly rises (annualised) of 19.1% in the quarter to April 2022, 8.6% in the quarter to July 2022, 12.5% in the quarter to October 2022 and 0.8% in the three months to January 2023. The sharp jump in prices in the period from February to April 2022 was driven by a rapid rise in energy prices following Russia’s invasion of Ukraine that added to existing inflationary pressures, turbo charging the rate of inflation. Since then, prices across the economy have risen rapidly, although with wholesale energy prices retreating from their peak recently, the overall rate of price rises has slowed down significantly in the last quarter.
The chart also shows how the consumer price inflation index (the CPI Index) increased from 109.0 in January 2021 to 114.9 in January 2022 and to 126.4 in January 2023.
The chart doesn’t show the intermediate annual rates of inflation, although these can be calculated using the geometric average of the preceding four quarters. The annual rate increased from 5.5% in January 2022 to 9.0% in April 2022, then to 10.1% in July 2022 before reaching a peak of 11.1% in October 2022, following which it fell to 10.1% in January 2022.
Successively dropping quarters from the previous year out of the year-on-year comparison and replacing them with price rises over the most recent quarter saw inflation rise as quarterly rises (annualised) of 4.3% fell out to be replaced by 19.1%, 4.4% by 8.6%, and 8.7% by 12.5%, before inflation fell over the last three months as 4.5% was replaced by 0.8%.
These ‘base effects’ mean that most commentators expect a sharp slowdown in the annual inflation rate over the next nine months as monthly and quarterly price rises over that time should be much lower than the comparatives falling out of the year-on-year calculation. The biggest fall is expected over the next three months, as even with a sizeable rise in domestic energy prices expected in the month of April 2023 as government support is withdrawn, price rises are expected to be much lower than the 19.1% annualised rate seen in the quarter to April 2022.
While the medicine of higher interest rates is no doubt playing a key part in restraining prices from rising as fast as they did last year, the Bank of England knows that arithmetic should be the biggest contributor to inflation coming down over the course of 2023.


