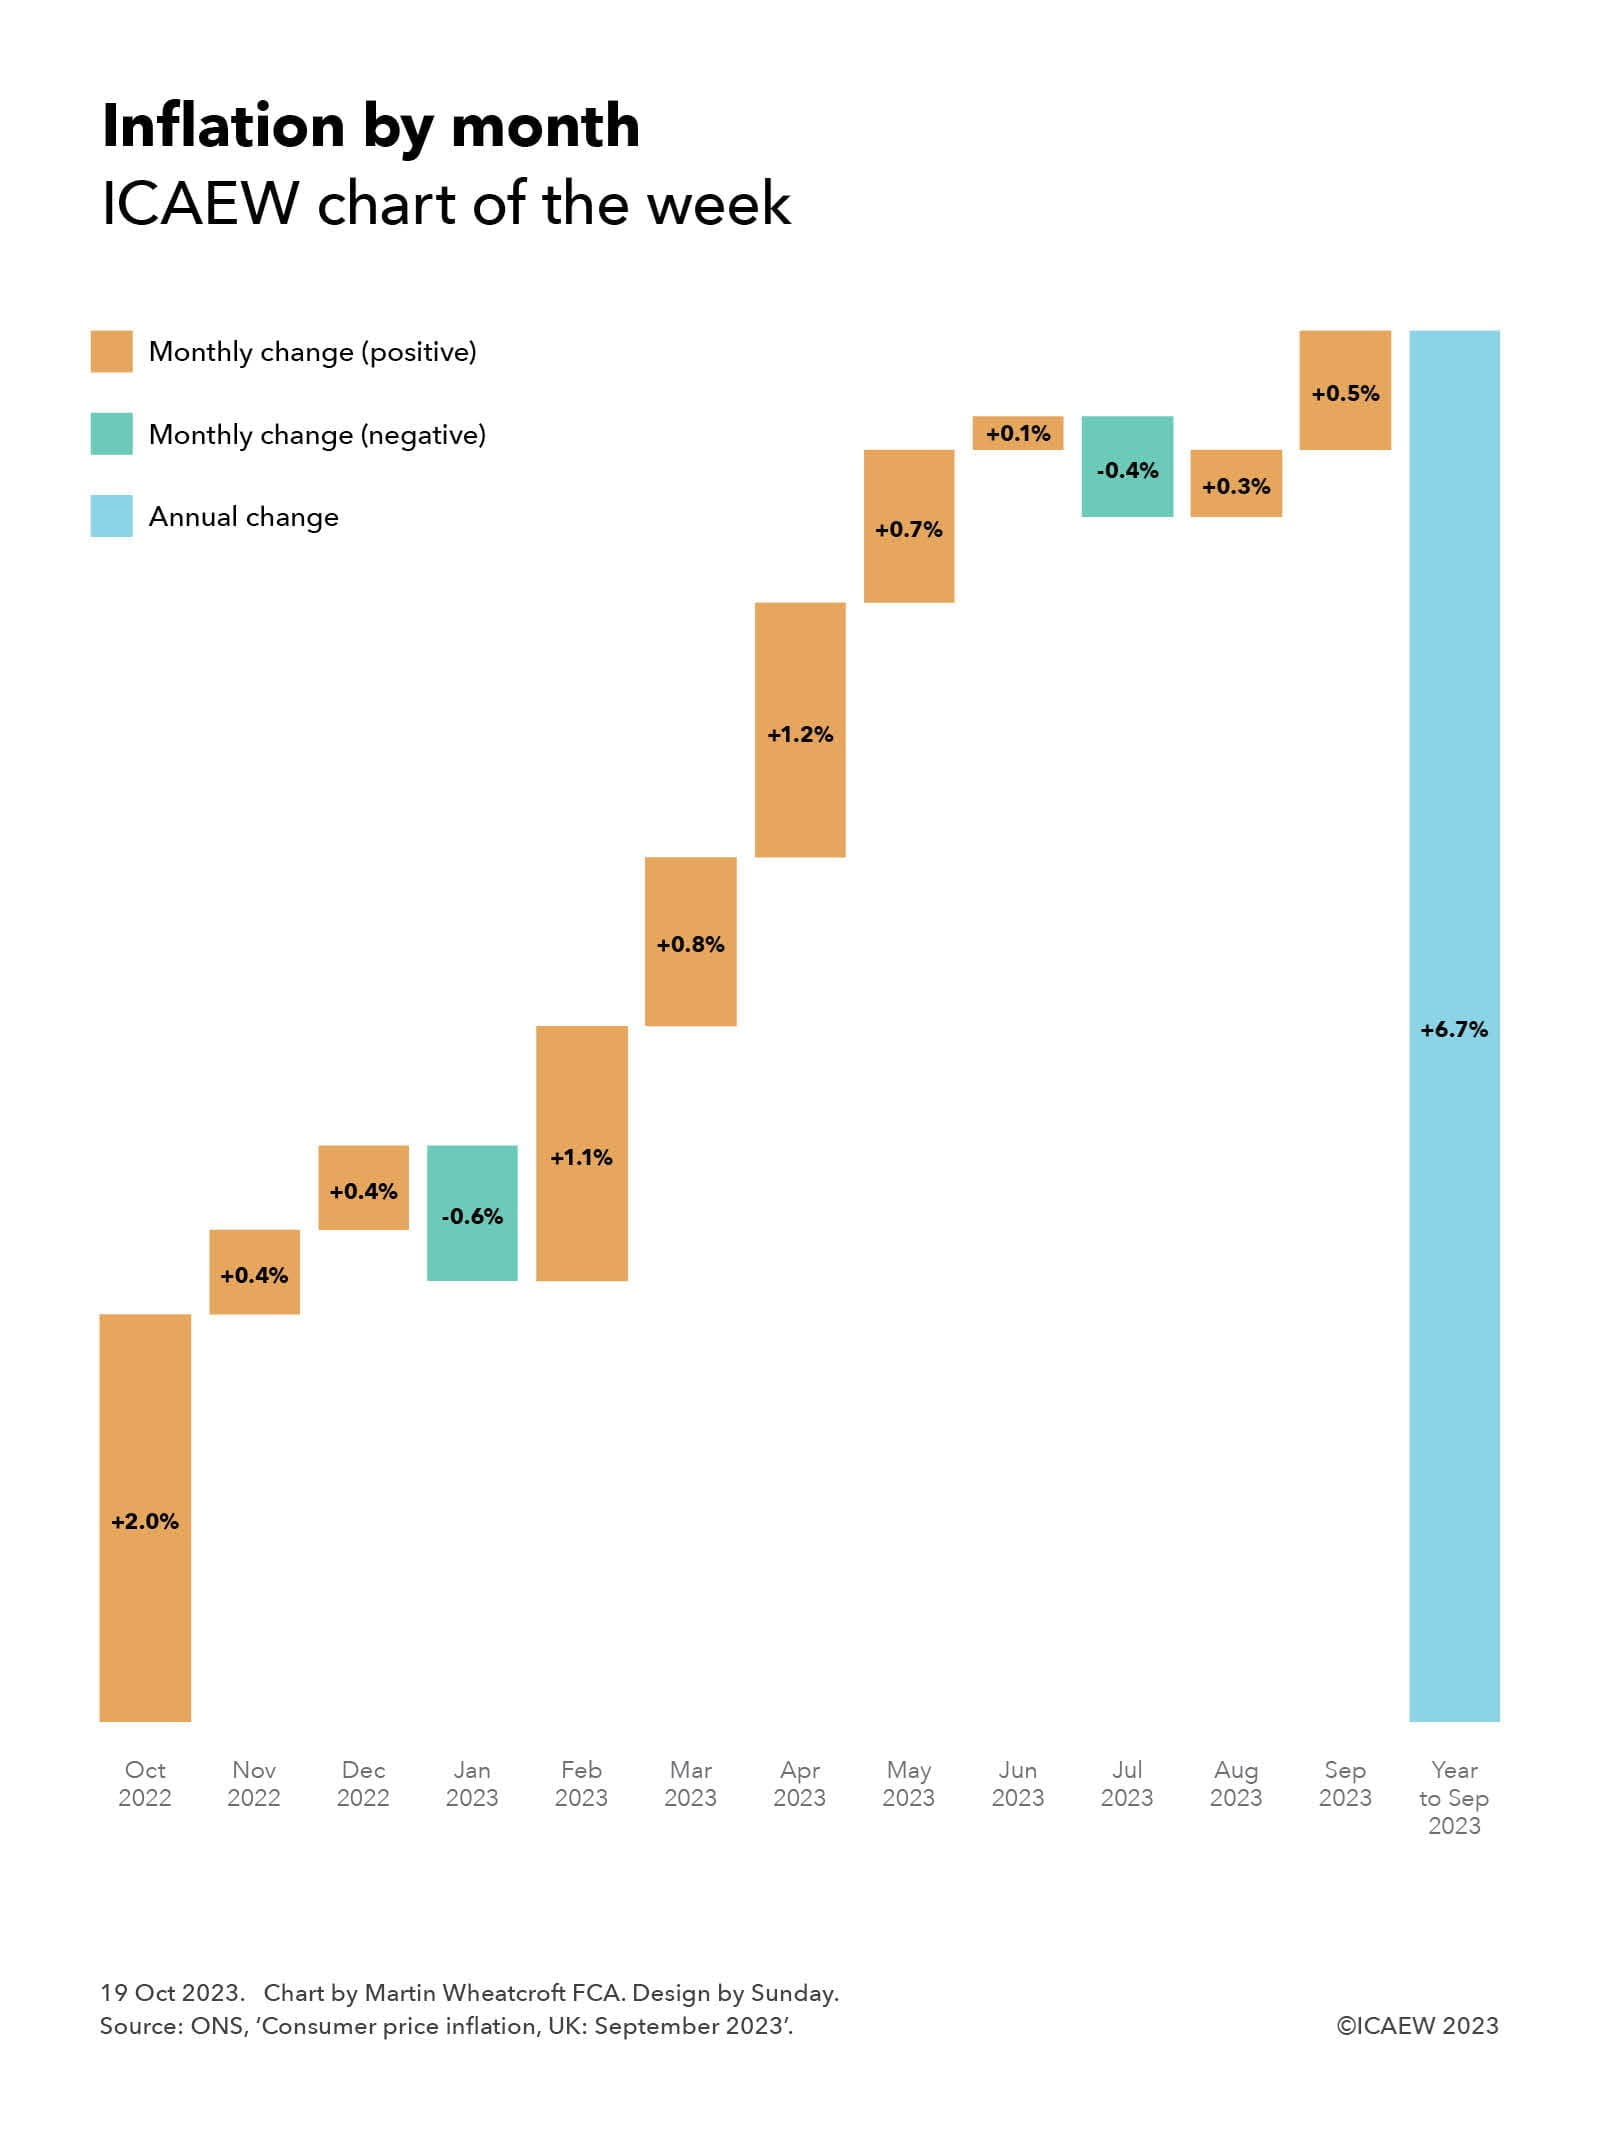
The Office for National Statistics (ONS) reported on 18 October 2023 that the annual rate of consumer price inflation (CPI) for the year to September 2023 was 6.7%.
Our chart this week illustrates how this is made up of monthly inflation rates from October 2022 through September 2023 of +2.0%, +0.4%, +0.4%, -0.6%, +1.1%, +0.8%, +1.2%, +0.7%, +0.1%, -0.4%, +0.3% and +0.5% respectively.
As well as highlighting how the monthly inflation rate can bounce around from month to month, including a couple of times where prices went down, it shows how a big jump in the consumer prices index of +2.0% in October 2022 is a significant component in the annual rate reported for the year to September 2023.
This provides an insight into what is likely to happen to inflation when it is reported next month. Instead of a large rise in domestic energy prices (a 17% increase in the cost of electricity and a 37% increase in the cost of domestic gas between September and October 2022 according to the ONS) that drove the +2.0% reported a year ago, the expectation is that energy prices will drop between September and October 2023 following Ofgem’s decision to reduce the energy price cap by 7% for the current quarter.
When the +2.0% monthly increase from October 2022 drops out of the index to be replaced by a much smaller monthly increase for October 2023 (or even potentially a monthly decrease), the annual rate of inflation should reduce significantly – potentially to as low as the 5.3% ‘halved’ rate of inflation aspired to by the Prime Minister.
For a broader insight into the UK economy, read ICAEW’s economic update October 2023: where next for interest rates?


