Power View, along with PowerPivot and Inquire, is one of the Excel 2013 features that Microsoft has decided to limit to those that have the Professional Plus edition of Excel or Office. If you do have the right edition, you should see Power View in the Reports group of the Insert ribbon. If you haven’t used Power View before then, when you click on the Power View option, you will be asked if you want to enable the Power View add-in.
Power View works with data in a similar way to a PivotTable or Power Pivot, but instead of producing a table of data or a chart based on a table of data, it creates a new worksheet that contains different ‘visualisations’ of the data.
If you use the Excel 2013 Get External Data commands, once you have connected to the external data that you want to use, you will have the option to create a Table, a PivotTable Report or PivotChart, or a Power View Report:
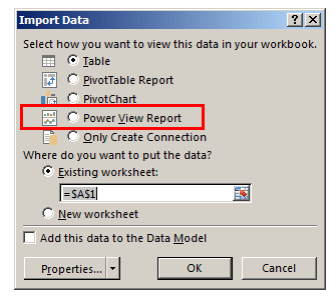
In this example we have chosen our favourite Northwind Invoice data and chosen Power View Report:
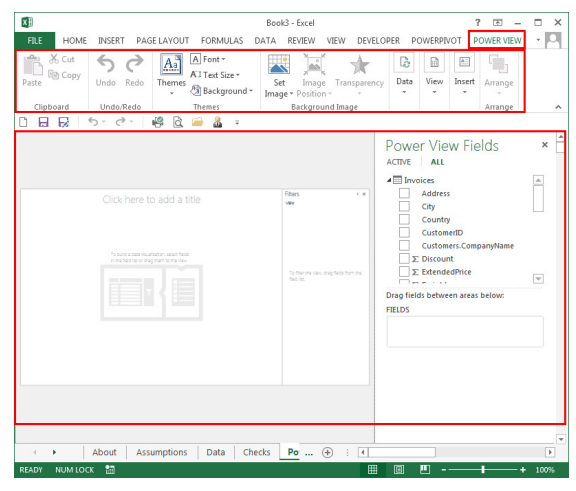
Unlike a Table or PivotTable, we don’t just end up with an object inserted into a normal Excel worksheet, but instead we have a special Power View sheet with a Power View ribbon and a Field List, similar to that for a PivotTable, including the fields from our external data:
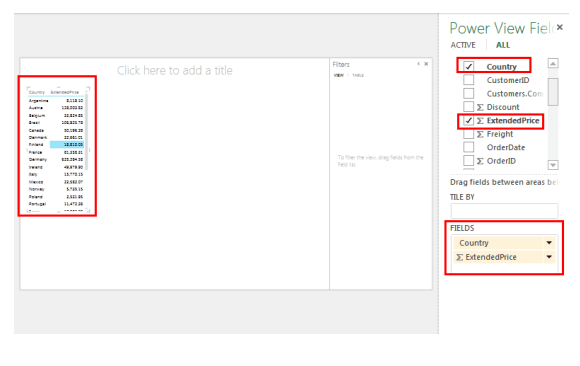
Here, we have just selected two fields as we might do for a PivotTable and they are automatically added to a Power View visualisation:
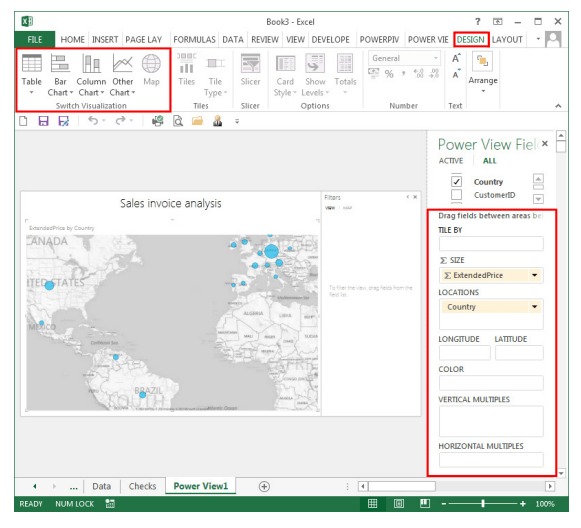
Power View adds a table summarising the data on our Power View sheet. There is no great advantage over a PivotTable so far, but Power View lets us choose additional types of graphic, such as a map. We have gone to the Power View, Design ribbon and, in the Switch Visualisation group, chosen Map. We have increased the size of the map and typed in a title for our Pivot View sheet. When we choose to use a map, additional field options appear in our Field List area:
We’ll look at some of the field options. First, we’ll drag the Salesperson field to the Colour area:
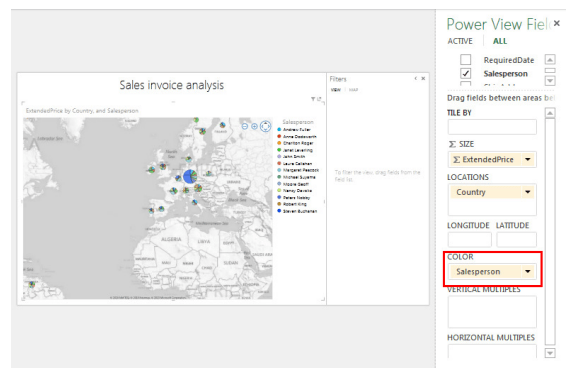
We’ve zoomed in a bit to see that our blue circles indicating the total value of cells have now been changed to small pie charts showing sales by salesperson. To demonstrate one of the other areas, we’ll drag the Salesperson field into the ‘Tile By’ area:
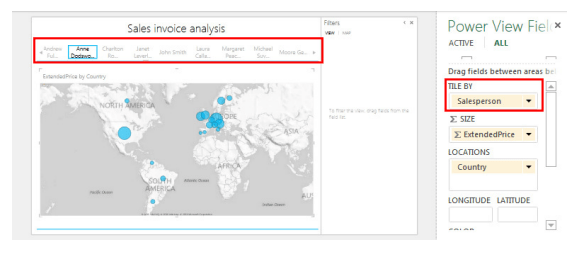
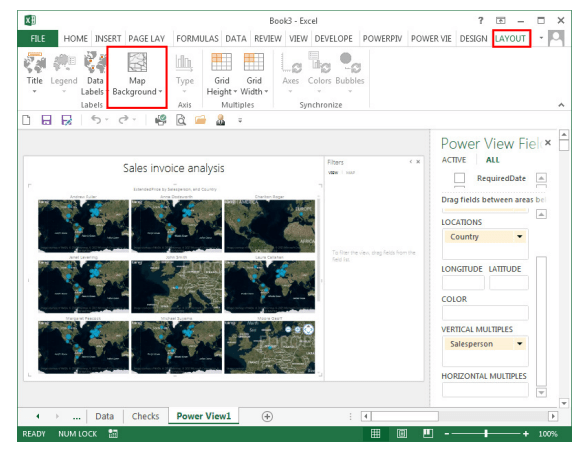
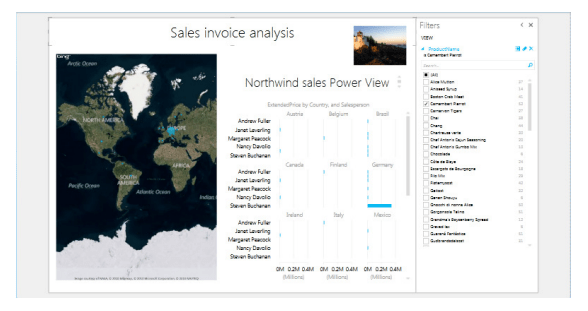
Now we see multiple maps – one for each salesperson. Before we leave maps, we’ll use an option on the Power View Layout ribbon to turn our map backgrounds into satellite images. We can also choose between colour and greyscale versions of the different map backgrounds:
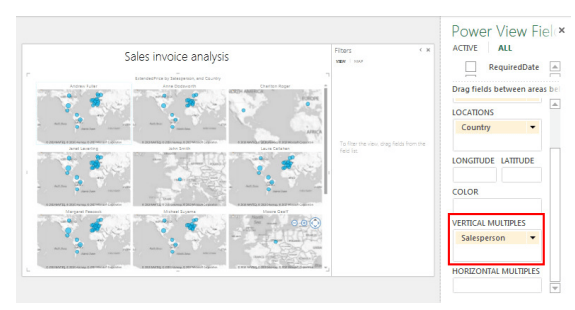
Power View reports are designed to accommodate multiple objects including pictures and text boxes as well as other data ‘visualisations’. We can also add fields to the Filters area to allow users to select from. In this example we have added a picture and a text box and used ProductName as a filter. We have clicked in an empty part of the Power View area and added Salesperson and ExtendedPrice and then used Country as a multiple for our additional bar chart:
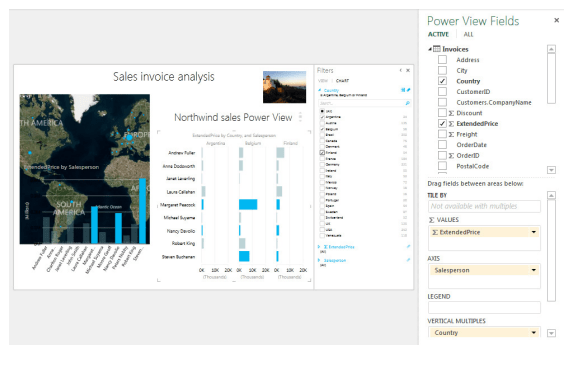
You can be even more creative and overlay one chart on top of another chart. Charts are also synchronised so you can select a bar, or use Control+click to select multiple bars, and other charts in the Power View will have the same bars highlighted:
You can be even more creative and overlay one chart on top of another chart. Charts are also synchronised so you can select a bar, or use Control+click to select multiple bars, and other charts in the Power View will have the same bars highlighted:
Trademark acknowledgements
Excel is a registered trademark of Microsoft inc. Screen shots reprinted by permission from Microsoft Corporation
Archive and Knowledge Base
This archive of Excel Community content from the ION platform will allow you to read the content of the articles but the functionality on the pages is limited. The ION search box, tags and navigation buttons on the archived pages will not work. Pages will load more slowly than a live website. You may be able to follow links to other articles but if this does not work, please return to the archive search. You can also search our Knowledge Base for access to all articles, new and archived, organised by topic.

