The end of part two left us clinging precariously to the edge of the DAX cliff, with our last year totals not agreeing with the individual salesperson figures for some years because, for those years, there were no values in Invoices[OrderDate] for PREVIOUSYEAR(). In this part we will create a table containing all possible dates to overcome this problem and then go on to consider budgets and variances.
Dates table
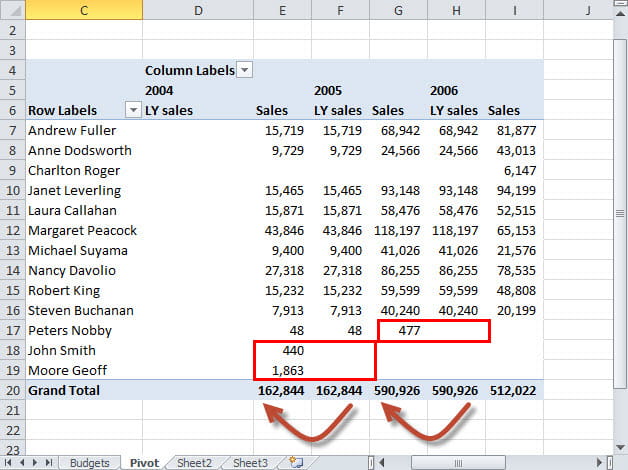
Here is our current PivotTable, as we left it last time, with certain Salesperson figures absent for both the 2006 LY Sales and 2005 LY Sales columns:
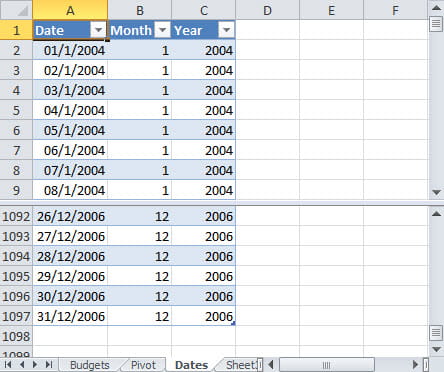
To restore our missing values we will add a new sheet to our workbook and add a table that contains each of the possible dates that might exist in our data. We have also used standard Excel MONTH() and YEAR() functions to create the date ‘groups’ we want to work with:
Linked tables
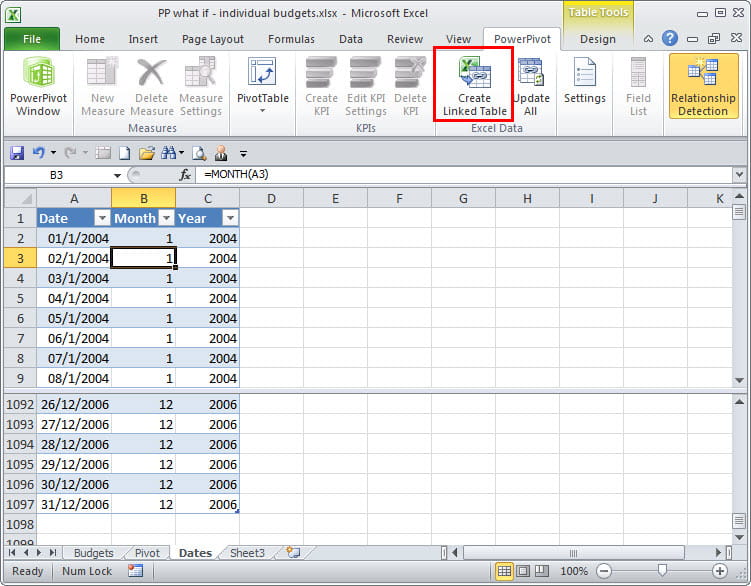
One of the real advantages of PowerPivot over normal PivotTables is the ability to combine data from different sources. One of the available sources is a table within the same workbook so we can include our new date table in our PowerPivot data model. To do this we just select any cell in the table and choose Create Linked Table from the Excel Data group of the PowerPivot contextual ribbon tab:
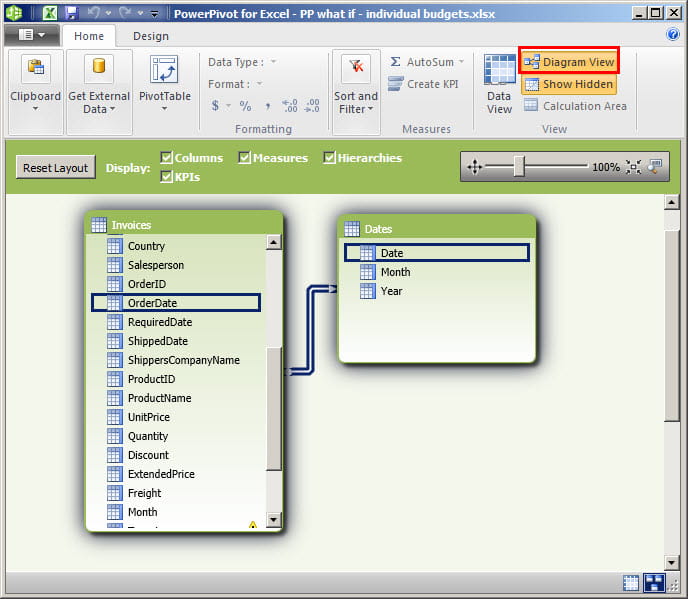
We can then go to the PowerPivot Window, switch to diagram view and drag from Order Date in Invoices to Date in Dates to create the link between our two tables:
We can now restructure our PivotTable to use the Year field from the Dates table rather than from the Invoices table. Because the Dates table includes all possible dates for our data, PREVIOUSYEAR() will always have current year dates to work from, so our ‘missing’ data will reappear:
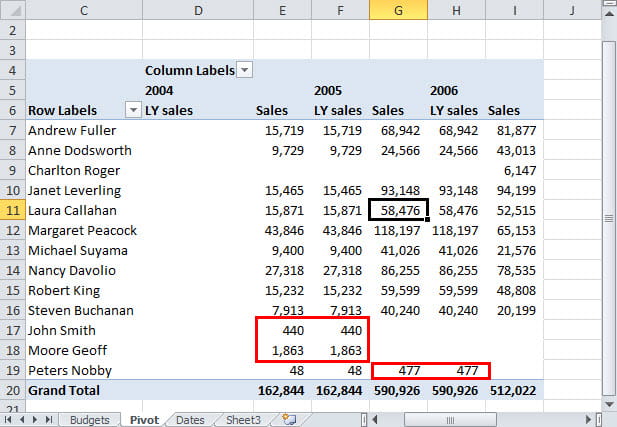
So far, it looks as though we’ve gone to a great deal of trouble to achieve very little. Our LY Sales columns just duplicate the information available much more easily from our other Year columns. However, we can extend the idea to produce more useful information. We are going to add another Excel Linked Table, this time to hold a percentage for each salesperson that we can use to create a budget based on an uplift to the previous year sales figure. This table is then included in the PowerPivot data model in the same way as the table of dates:

For simplicity, we have just used the salesperson name to create our link, but a numeric ID would probably be preferable:

We then use the ‘Data Analysis Expressions’ (DAX) within PowerPivot to create an additional column in our invoices table that shows the value of each invoice modified by our target increase/decrease percentage:
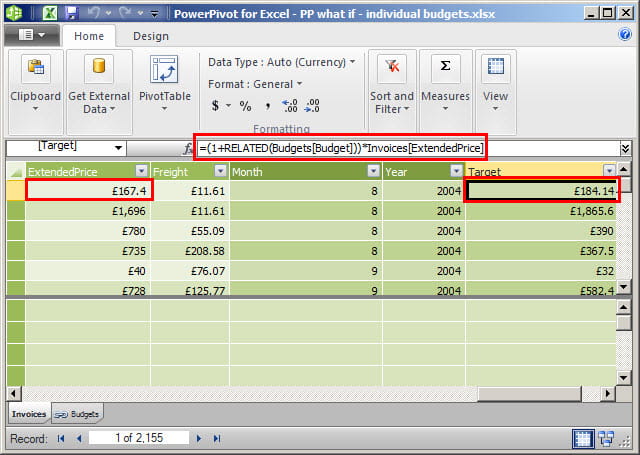
We now add two more measures to our PivotTable. The first uses the ‘Target’ column value and PREVIOUSYEAR() to create our target based on the figures for the previous year modified by our percentage. We have named this measure: Sales budget:
=CALCULATE(SUM(Invoices[target]),PREVIOUSYEAR(Invoices[OrderDate]),ALL(Dates[Year]))
A further measure then subtracts the target based on last year from the current year total. Note how the measure here uses the results of two other measures:
=Invoices[Sum of ExtendedPrice]-Invoices[Sales budget]
We have added a Slicer to our PivotTable based on the Year field in the Dates table and added all of our measures. The ‘variance’ column uses conditional formatting to display the positive/negative variances as data bars. The percentages in the Excel budget table are set up as references to the Budget uplift figure on the PivotTable sheet so this figure can be changed and the PivotTable updated to implement a different set of budget targets:

Other Office tips
Simon has recently had a book on Excel published by FSN Publishing Limited. ‘Maximising the Impact of Accounting & Financial Spreadsheets for Finance Users’ is available on Amazon or from the publishers directly. When bought from FSN. Tech Faculty members can claim a £5 discount using the code SHICAEW102. Simon has also included many useful Excel tips in the ‘Lunchtime Learning’ section of his website.
Trademark acknowledgements
Excel is a registered trademark of Microsoft inc. Screen shots reprinted by permission from Microsoft Corporation
Archive and Knowledge Base
This archive of Excel Community content from the ION platform will allow you to read the content of the articles but the functionality on the pages is limited. The ION search box, tags and navigation buttons on the archived pages will not work. Pages will load more slowly than a live website. You may be able to follow links to other articles but if this does not work, please return to the archive search. You can also search our Knowledge Base for access to all articles, new and archived, organised by topic.

