Principle 5 of the ICAEW 20 Principles for Good Spreadsheet Practice states that you should: "Before starting, satisfy yourself that a spreadsheet is the appropriate tool for the job". One of the most common transgressions of this principle is the use of a spreadsheet to input and manage data that would be better stored in a database application.
However, there seems to be a significant difference in how spreadsheets and databases are perceived. In general, spreadsheets are seen as a user application that pretty much anyone can have a go at, whereas databases tend to be seen as much more technically difficult and as very much preserve of IT experts rather than everyday users. As a result, users are often much more comfortable sticking with Excel rather than creating a database solution.
In the following two-part example, we will be considering the entry of some simple data and seeing how, even in a spreadsheet, a little knowledge of how best to structure data can make data entry more efficient and more reliable as well as making it much easier to create any required analyses of the data. There is certainly an argument, even in this simple example, that Principle 5 should apply but we'll be guided by Otto von Bismarck and concentrate on the art of the possible. At the very least, any increased familiarity with data structures will be extremely useful when it comes to working with Power Query within Excel.
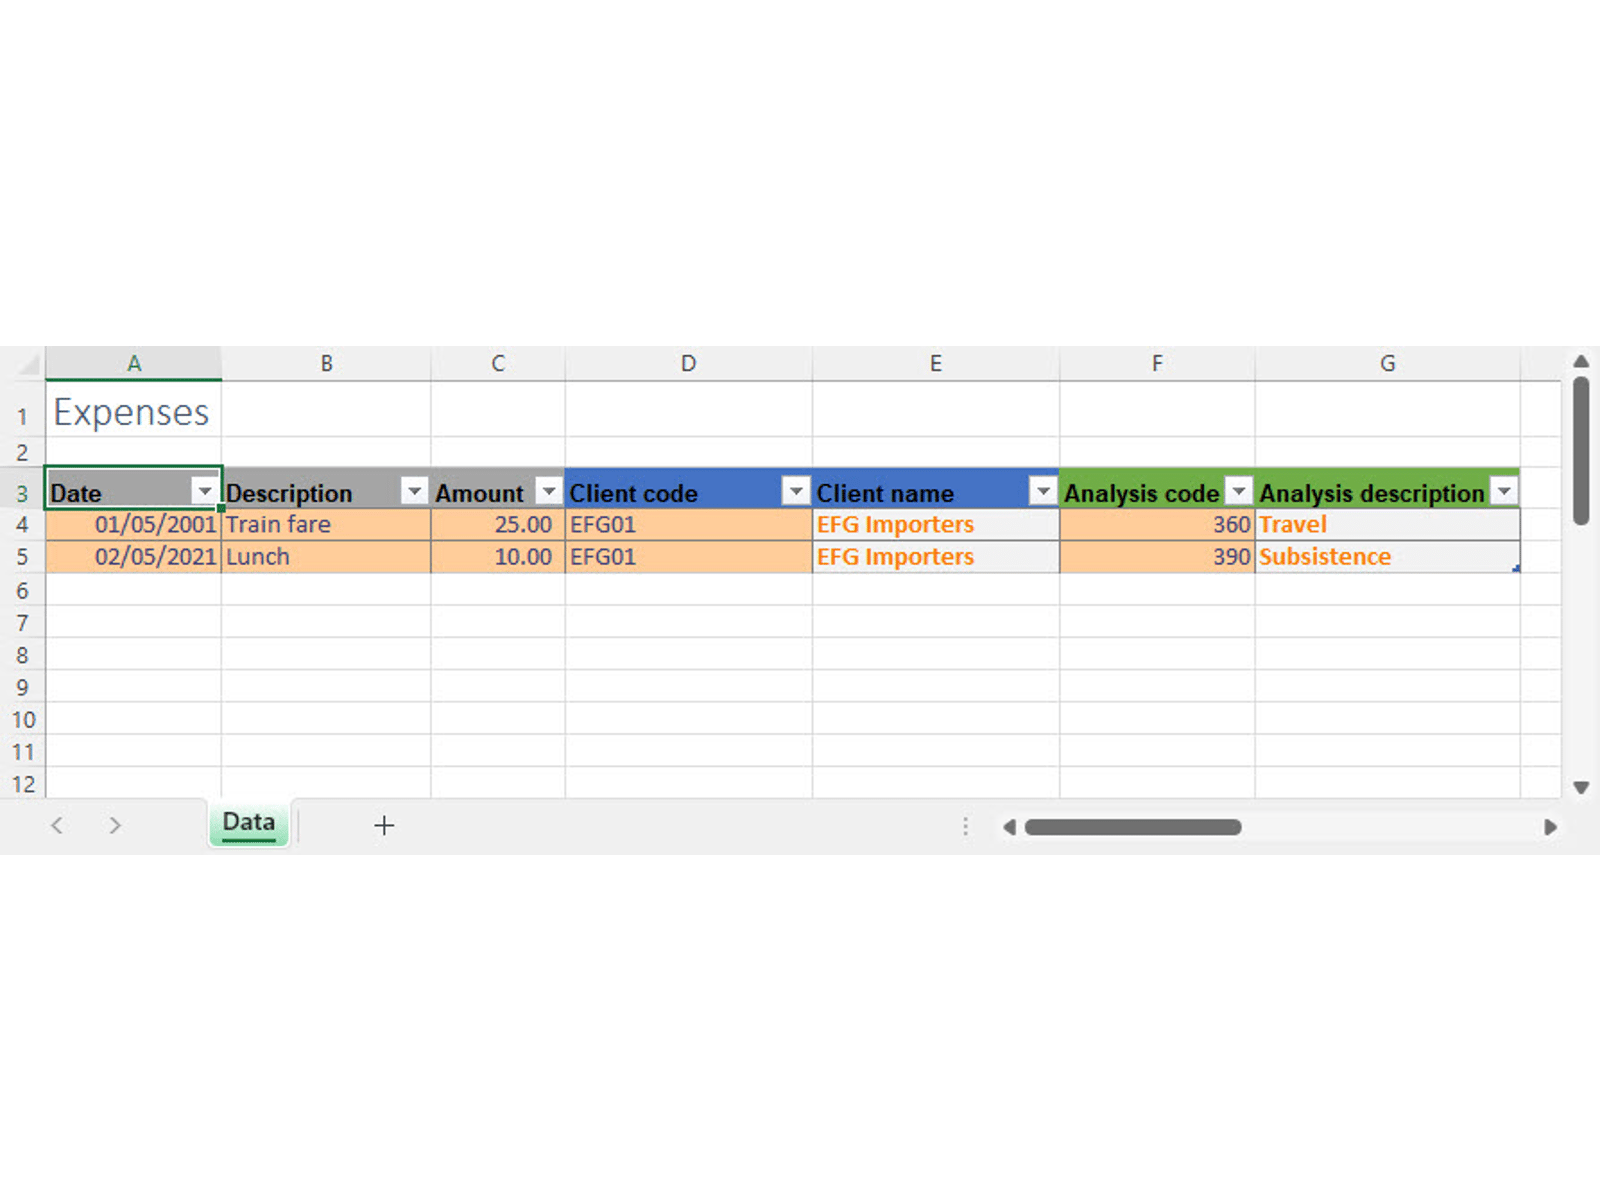
We are going to create a very simple list of expenses with columns for the transaction date; a text description of the expense; the amount; a client code and client name and a nominal analysis code and description. It's probably fair to say that most spreadsheet users would be likely to create this as a single table.

Without venturing too far into the realms of relational database theory, there are clearly issues with the single table approach. Assuming that lots of transactions will be incurred on behalf of the same clients and analysed to the same nominal codes, any client and nominal code information will have to be repeated over many rows. This is not only an issue of efficiency, but also one of accuracy. If we need to type in the same client name multiple times, there is an ever-increasing likelihood of inconsistencies. This could have important consequences. If we were trying to calculate the total value of expenses incurred on behalf of a particular client, it would be very easy to miss entries that had been misspelt or were otherwise inconsistent. The problem is compounded the more information that we need to hold for each client. If everything is in a single table, then we would need to enter a phone number or an email address on every row for example.
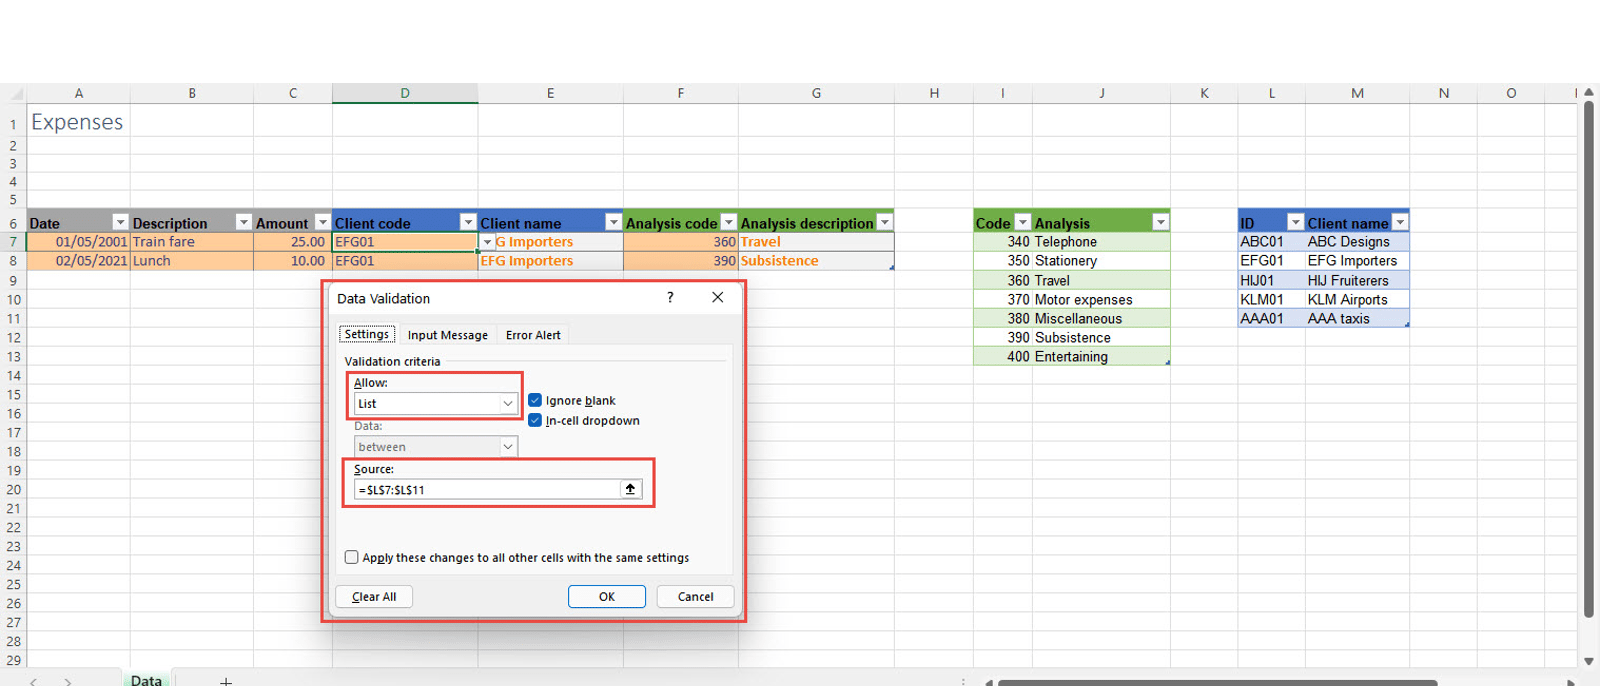
If we look at the data from more of a database than spreadsheet point of view, then we would decide that we needed one separate table to hold all our client details and another to hold our nominal account details. We would probably put our tables on separate sheets but to make it easier to see what is going on, we have included them here on the same sheet as our main expenses table:

Having split our data across separate tables, we need to be able to recombine the information held in all of those tables in order to end up with an intelligible result. We will do this using Data Validation lists and lookup formulae.
We are going to need to identify which code and which client each row of our Expenses table relates to. For this reason, our Code table and our Client table both need a unique identifier for each row. We can then use Data Validation in the Client code and Analysis code columns of our Expenses table to allow us to select the appropriate identifier from each table using a dropdown list. The Client name and Analysis description columns use a lookup formula to return the Analysis or Client name that corresponds to the identifier chosen in the adjacent column. As David Lyford-Smith pointed out in a recent Tip of the Week looking at Data structure good practices, for all of this to work as automatically as possible, it is vital that our tables of data are set up as Excel Tables. Because Excel Tables expand automatically as rows are added, our Data Validation list source can be set up to automatically include rows added to the Code and Client Tables. In addition, Data Validation settings will be copied automatically to new rows in our Expenses Table as will the lookup formulae that retrieve the Client name and Analysis description.
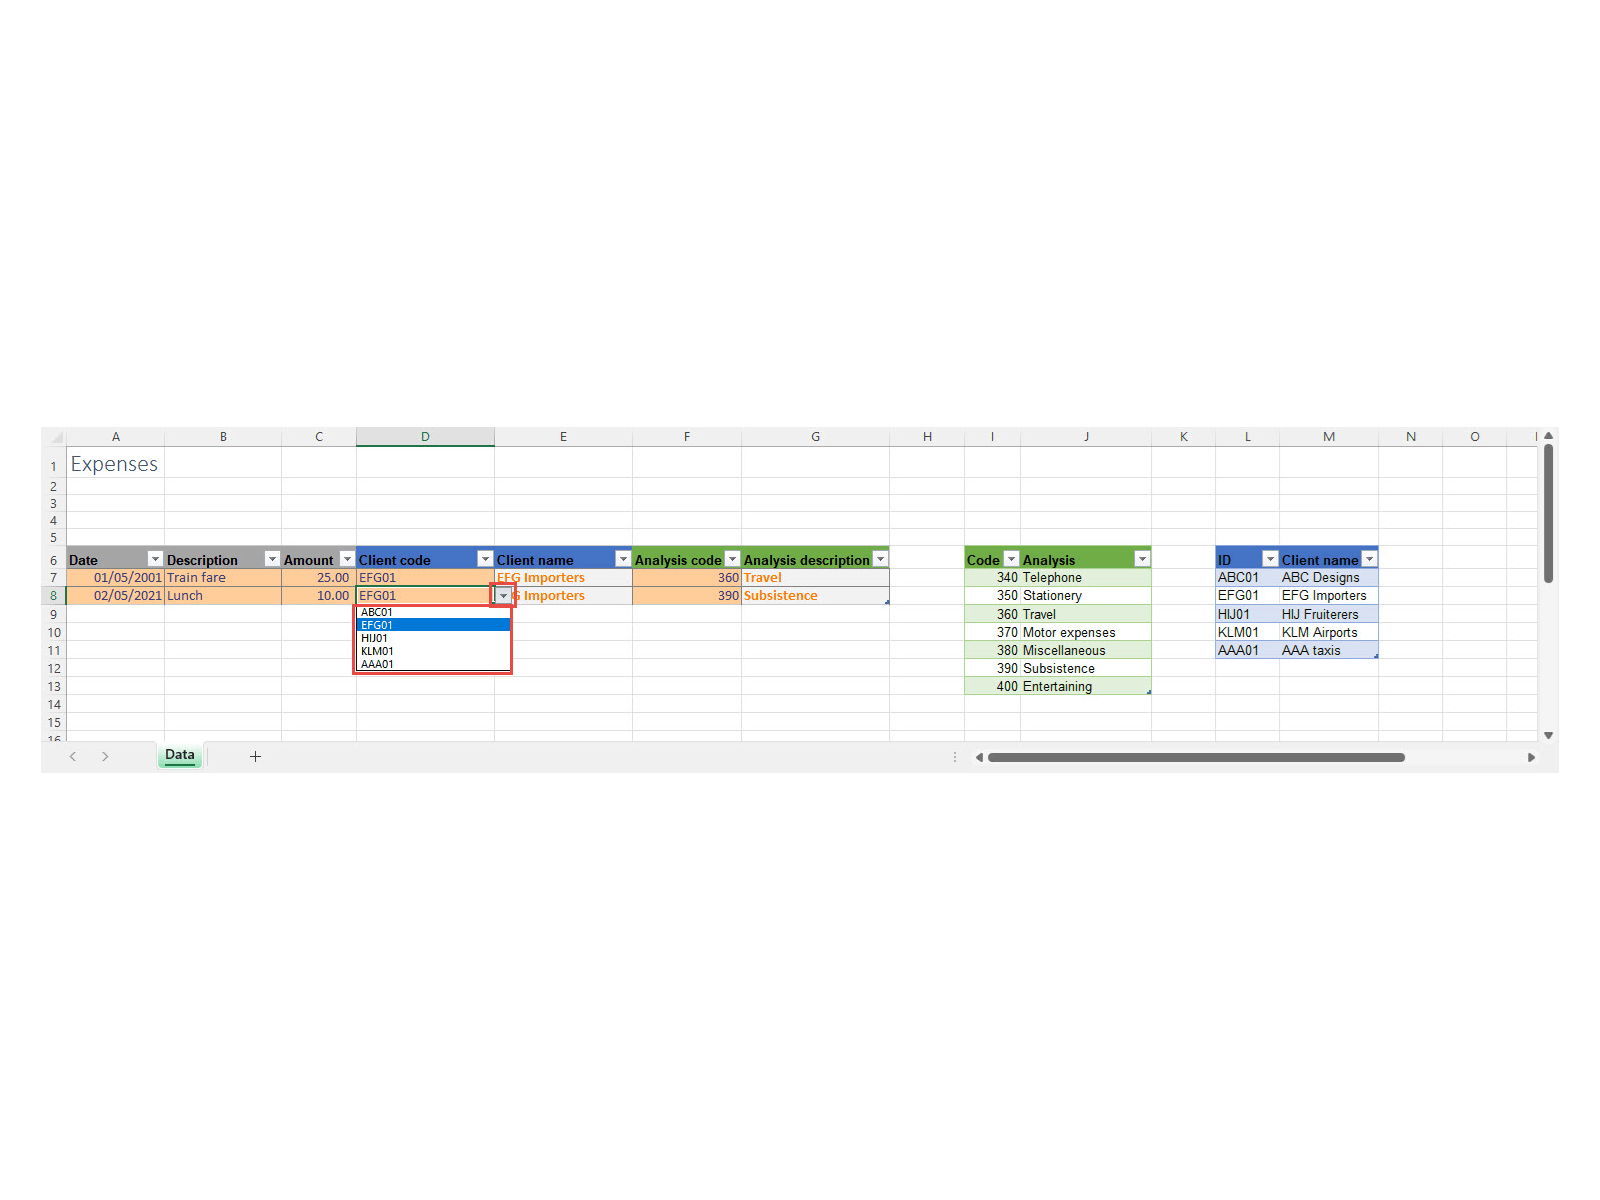
We'll look at the Data Validation settings in the two code columns of our Expenses Table first. As well as helping prevent users enter the wrong sort of data in a cell, Data Validation can also be used to allow users to select entries from a list which will be displayed as a dropdown in the cell. Here is the setting for column D of our Table:


By creating our separate Tables, users no longer have to type in code or client details, with the possibility of making data entry errors in so doing, instead they just need to choose from a list.
In part 2 we will look at the use of lookup formulae to trample all over another one of our 20 Principles as well as using a recent Excel enhancement to make our dropdown lists easier to use. We will also consider some of the drawbacks of using Excel in this way.
Archive and Knowledge Base
This archive of Excel Community content from the ION platform will allow you to read the content of the articles but the functionality on the pages is limited. The ION search box, tags and navigation buttons on the archived pages will not work. Pages will load more slowly than a live website. You may be able to follow links to other articles but if this does not work, please return to the archive search. You can also search our Knowledge Base for access to all articles, new and archived, organised by topic.

