So, a few days after the touchdown of one massive leap for mankind on a different planet, another one launches. The Spreadsheet Knowledge Base was inspired by the change in web platform for the ICAEW communities last year.
Part of this process transferred the wealth of existing articles into a separate archive using 'Archive-It'. Although both the Tech and Excel Communities include well-signposted links to a search facility for each archive collection, a simple word search fails to reveal the true breadth and depth of the resources available.
Accordingly, the decision was made to find a way to increase the value of the archive to all of our members. As befits a spreadsheet community, we decided to use Excel and Power BI to create our archive portal. For anyone who would like to follow the process in detail, we have started a series of posts documenting the methods and techniques involved. The first two parts are here:
- Excel Community project - rescuing the lost archive
- Excel Community project – rescuing the lost archive – part 2
Before raising expectations too high, there are some issues. The portal is still very much a work in progress, both as regards the overall design and the cataloguing of the content and we would really appreciate any comments and suggestions on its future development: excel@icaew.com. In order to highlight the areas covered, we have added several additional properties to identify each article, including series, keywords, summaries and a level based on the Spreadsheet Competency Framework. At the time of writing, we are only part of the way through this process, so not all articles will yet appear in some searches and displays. Also, you will need to be patient, it does take a little longer to retrieve articles from the archive than going directly to a current article (approximately 10 seconds).
This is the link to the current version of the Power BI based portal:

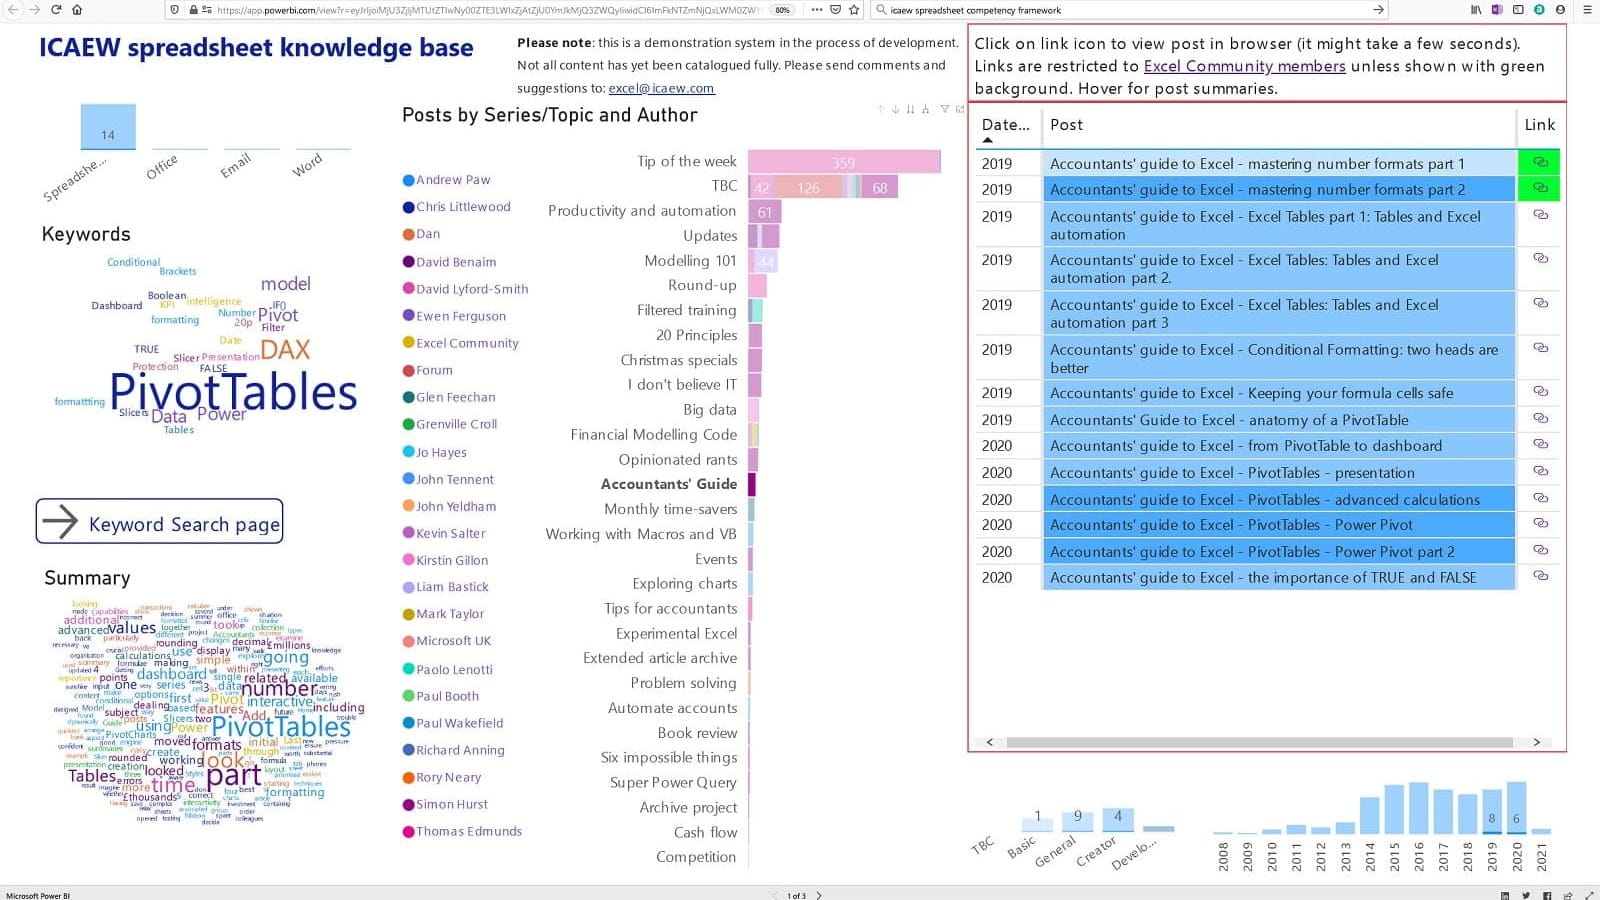
The list of posts is displayed to the right-hand side of the screen and each post can be opened in a separate browser tab by clicking on the link icon. The links shown with a green background are publicly available, having originally been posted in the IT Counts/Tech News area, other links are restricted to Tech Faculty and Excel Community members. Post titles are shown with a blue shading that represents a guide to the level of the article with deeper shades used for more advanced levels in the Spreadsheet Competency Framework. Hovering over a post title will display a brief summary of the contents (where available).
The central section of the screen displays posts by series or, for posts that are not part of a specific series, by broad topic. The posts are also sub-divided to show the author. Because of the way that Power BI visualisations work, clicking on a series (chart bar or title), or on an author, will filter the list of posts to display just those that have been categorised accordingly. In the example above, we have clicked on the Accountants' Guide series.
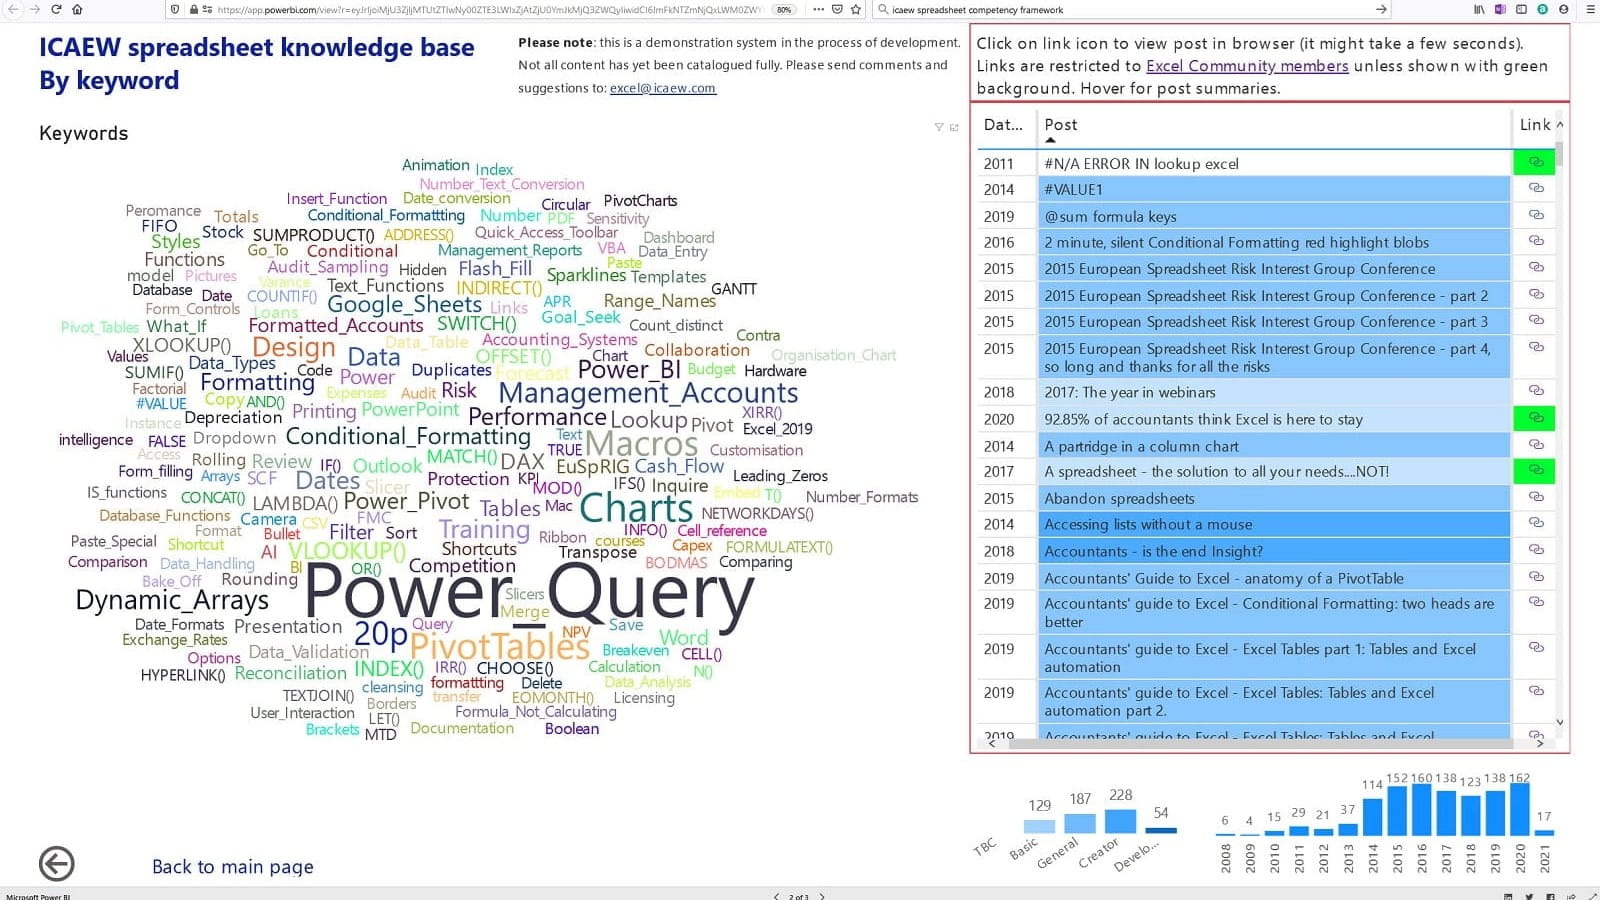
To the left of the series/author chart we have included two 'Word Cloud' visualisations of the keywords and summaries linked to each post. Again, clicking on a word in the word cloud will display relevant posts. Power BI reports can include multiple pages, so we have added a Keyword Search page that enlarges the Keyword word cloud:

We will continue to work on the design of the portal and the cataloguing of the contents. Hopefully, by providing some sort of structured guide to the archive contents, we can help make the Tech News and Excel Community an even more accessible and practically useful resource to solve the everyday spreadsheet problems of the accounting communities.
Excel community
This article is brought to you by the Excel Community where you can find additional extended articles and webinar recordings on a variety of Excel related topics. In addition to live training events, Excel Community members have access to a full suite of online training modules from Excel with Business.

Archive and Knowledge Base
This archive of Excel Community content from the ION platform will allow you to read the content of the articles but the functionality on the pages is limited. The ION search box, tags and navigation buttons on the archived pages will not work. Pages will load more slowly than a live website. You may be able to follow links to other articles but if this does not work, please return to the archive search. You can also search our Knowledge Base for access to all articles, new and archived, organised by topic.
