Not all IRRs are IRRelevant…
I’m still not certain what frankincense is, I am pretty sure I’ll never get to grips with gold, but at least I can explain MIRR!
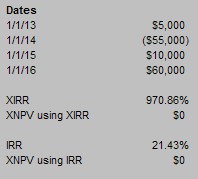
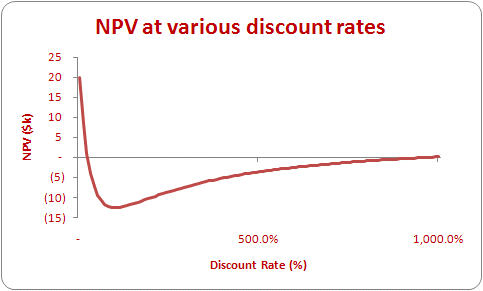
I have previously discussed the dangers of modelling – and using – Internal Rates of Return (IRRs), i.e. the discount rate which makes the Net Present Value (NPV) zero [0]. Every time a cashflow series changes sign (i.e. goes from positive to negative or vice versa) there is potentially another solution to the Internal Rate of Return (IRR). Consider the following:


Here, prompted by a guess in the XIRR function (albeit of the other solution 21.43%), the two common Excel functions XIRR and IRR return the two IRRs associated with this cashflow scenario. It is important to not only check that an IRR gives an NPV of zero but that it is also the correct one in the circumstances.
This is the first problem with the concept of IRR. However, before we look at an objective way to generate just one meaningful solution for analysis, I’d like to consider another key issue. Forget the almost nonsensical IRR of 970.86% quoted in the above example. The other solution, 21.43%, seems more “realistic”, yes?
As mentioned above, the Internal Rate of Return (IRR) is the name given to the discount rate that makes the Net Present Value (NPV) of a range of cashflows zero. For example, if I invest $100 now and receive $121 back in two years’ time this would give me an annual IRR of 10% since:
|
($100) + PV($121)
NPV |
= = = |
($100) + $121 / (1 + 10%)2 ($100) + $100 0 |
It is nothing more than this. Put simply, if all cash required is borrowed at 21.43% and all surplus cash is reinvested at 21.43%, my project would neither create nor destroy cash value.
Wait a minute. Reinvest at 21.43%..? If I could find a risk-free investment returning this sort of money I would be depositing my pension in it never mind stakeholders’ funds. The symmetry of the finance rate (cost of borrowing, typically the Weighted Average Cost of Capital) and the reinvestment rate (the return surplus funds can generate) is usually an absurd notion in the real world: if gains could be made in a free market, the principle of arbitrage would soon erode this advantage.
If we are looking for a measure to address the multiple solutions issue of IRR, perhaps we should also ensure it considers the fact that finance rates tend to be greater than reinvestment rates.
Walkthrough example
I am going to suggest the alternative measure of Modified Internal Rate of Return (MIRR). To explain how this works, I will be using the following example, which is included in the associated Excel file.
Consider the following assumptions:

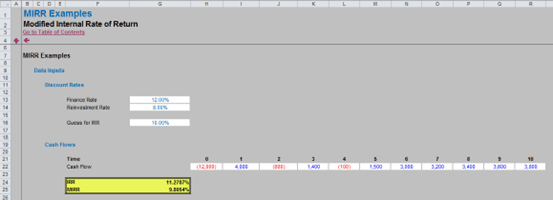
Let’s keep this example nice and simple. Here, I have assumed a finance rate of 12%, a reinvestment rate of a more realistic 8% (say) and cash flows generated periodically at 11 points of time (Time 0 being “now” to Time 10 being 10 periods from “now”). Notice that the cash flows change sign a total of five times, which means there could be potentially five different IRRs.
This is the reason for the “Guess” cell (G16) in the illustration above. The IRR formula in cell G24 is
| =IRR(H22:R22, Guess) |
where changing the value of Guess may cause the IRR calculated to vary (i.e. generate an alternative solution).
The MIRR calculation (cell G25) is simply
| =MIRR(H22:R22,Finance_Rate,Reinvestment_Rate) |
where the Finance_Rate is entered in cell G13 and the Reinvestment_Rate is entered in cell G14. The formula for MIRR is defined as follows:

where:
- NPV() is the Excel NPV function
- rrate is the reinvestment rate
- frate is the finance rate
- values[positive] is the positive values in the array only
- values[negative] is the negative values in the array only
- n is the number of periods
This formula will always give the same value regardless of the number of changes of sign in the cash flow. It also considers the disparity between reinvestment and finance rates. It ticks the boxes – the only question is: what on earth does it do?
It’s quite simple actually in concept. Let’s ignore the formula and perform the calculation manually with the example above.
The first problem we have is the number of sign changes (five). To get an objective measure, we need just the one change of sign to ensure a unique solution. How do we do that?
To begin with, the cash flows should be split in two as follows:

The associated Excel file clearly shows how this breakdown was arrived at using MAX() and MIN() functions.
The intention now is to replace the values in one or both rows by an equivalent single positive or negative number. This is not simply the summation of the rows as this does not take into account the time value of money (e.g. $100 reinvested would be worth $108 = $100 x (1 + 8%) in the next period using the above assumptions).
To work out what the discount factor should be, we need to determine the appropriate rate (finance rate for negative cash flows and reinvestment rate for positive cash flows) and at what point in time the cash flows are to be collated. We do this using the following table:

The Finance Rate calculates the appropriate discount factor required to generate the present values for Time 0 (i.e. the value of all negative cash flows as if they had arisen in the first period). This is because for most projects, companies will invest first (negative cash flows in early periods) to receive positive cash flows in later periods.
For example, the Time 2 factor (0.797, cell J33) is calculated as 1/1.122, i.e. discounting for two periods at the finance rate of 12%.
The Reinvestment Rate calculates the appropriate discount factor required to generate the present values for the final period (here, Time 10 or the 11th period) (i.e. the value of all positive cash flows as if they had arisen in the last period). As before, this is because for most projects, companies will invest first (negative cash flows in early periods) to receive positive cash flows in later periods – including the final period.
For example, the Time 7 factor (1.260, cell O34) is calculated as 1.083, i.e. inflating for three periods (= 10 – 7) at the reinvestment rate of 8%.
Now, we simply cross-multiply the discount factors (rows 33 and 34 in our example) by the split cash flows (rows 40 and 41), viz.

The negative numbers after Time 0 become smaller (reflecting the discounting), whereas positive cash flows are increasingly inflated the earlier they are to the final period (Time 10).
We now have three alternative cash flows we can consider:
- Aggregate the investment (negative) cash flows only;
- Aggregate the returns (positive cash flows) only;
- Aggregate both the investment cash flows and the returns.
Each of these options will only create one change of sign and consider the disparate discount rates. I now consider each one in turn.
1. Aggregate the Investment (Negative) Cash Flows Only
The associated Excel file calculates the following cash flow:

Row 85 shows a negative cash flow in the first period (being the sum of row 47) with non-negative cash flows thereafter (from row 41). Having zero in a period does not constitute a change of sign, but these cells must be zero rather than blank else the Excel functions will not calculate correctly.
Note that whilst the IRR changes slightly from the original calculation, the MIRR is precisely the same. This IRR is unique (only one change of sign).
2. Aggregate the Returns (Positive Cash Flows) Only
The following cash flow may be calculated:

Row 96 shows several negative cash flows (referenced to row 40) with a non-negative cash flow in the final period (being the sum of row 48).
Note that again the IRR changes from the original calculation (it is reduced since all positive cash flows have been moved to the final period), the MIRR is precisely the same. As before, this IRR is unique (only one change of sign).
3. Aggregate Both the Investments and the Returns (MIRR Approach)
This is the first cash flow shown in the Outputs section of the associated Excel file:

Row 73 contains only two non-zero flows: the present value of all investments at Time 0 and the future value of all returns At Time 10. As before, for this to work correctly, the interim period cash flows must be zero rather than blank.
As above, the IRR will be unique, but this time the IRR equals the MIRR. This is how the MIRR is calculated. Indeed, cell G77 contains an alternative method of calculation, the “Exponential Growth” approach, calculated as:
| =(32,366/12,701)1/10 |
This is essentially the MIRR formula:

where:
- NPV() is the Excel NPV function
- rrate is the reinvestment rate
- frate is the finance rate
- values[positive] is the positive values in the array only
- values[negative] is the negative values in the array only
- n is the number of periods.
Using the formula, MIRR is arguably quicker to calculate than IRR, more objective (only one solution) and considers the differing rates implicit in the cash flows. MIRR is usually lower than IRR (assuming the reinvestment rate will be lower than the finance rate), unless the reinvestment rate equals the finance rate, whereby altering the cash flows as depicted above will neither affect the NPV nor the IRR.
The MIRR is often seen as a financial measure of an investment's attractiveness. It is used frequently in capital budgeting to rank alternative investments of similar size (although this may not always be an appropriate approach: NPV or NPV per $ invested (the so-called “bang for buck” key factor analysis) may be more suitable metrics).
There is much confusion about what the reinvestment rate implies. However, both the NPV and the IRR techniques assume the cash flows generated by a project are reinvested within that same project. This is not always the case; often, they are often reinvested elsewhere within the business, and it is not a necessary assumption that the firm is capable of generating that IRR elsewhere. Indeed, one implication of the MIRR is that the project is not capable of generating cash flows as predicted and that the project’s NPV is overstated.
Archive and Knowledge Base
This archive of Excel Community content from the ION platform will allow you to read the content of the articles but the functionality on the pages is limited. The ION search box, tags and navigation buttons on the archived pages will not work. Pages will load more slowly than a live website. You may be able to follow links to other articles but if this does not work, please return to the archive search. You can also search our Knowledge Base for access to all articles, new and archived, organised by topic.

