
At times of uncertainly and high inflation the assessment of an organisation’s going concern is going to be high on the agenda for the Board and in particular the accounts sign off meeting with the auditor.
To remind ourselves of the criteria:
- An entity is a going concern unless management either intends to liquidate the entity or to cease trading or has no realistic alternative but to do so.
- Management should take into account all available information about the future, which is at least, but is not limited to, twelve months from the date when the financial statements are authorised for issue.
- Management should consider material uncertainties related to events or conditions that cast significant doubt upon the entity’s ability to continue as a going concern, the entity shall disclose those uncertainties.
To make these judgements with confidence and provide suitable evidence to the auditors requires the construction of a comprehensive business model that has taken available data, tested scenarios and evaluated potential outcomes.
The ICAEW has produced a detailed a guide to building a business model – The Financial Modelling Code.
So, in this blog we will focus on three key principles:
- Clever Engine - Allowing the handling of multiple options/scenarios and permutations.
- Dynamic Modelling - ‘Dynamic’ meaning that a change in any one assumption will always generate a valid answer.
- Multiple Scenarios - Explore multiple scenarios to understand the arena of possible results.
Clever Engine
The aim here is to build one highly flexible “engine” of a model through which multiple sets of data / scenarios can be passed. Problems can arise by creating numerous spreadsheets where each scenario is developed as a separate model. In such situations updates become difficult to apply consistently and thus results may be misleading to compare.
The approach is to have one model where all your Input assumptions are stored on one sheet and use the function =OFFSET(reference, rows, cols) to switch between each alternative scenario. =OFFSET is a function that enables indirect cell referencing. By defining a fixed cell (the reference cell), Excel will move away (or offset) by a user defined number of rows and columns. Once Excel has established the offset position then the value of the offset cell is displayed in the source cell.
ASSUMPTIONS
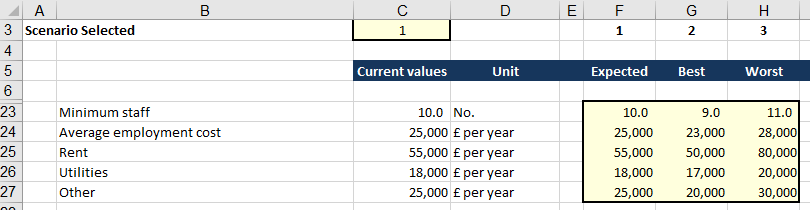
The assumption or input sheet should consist of the base data to drive the model. Each scenario should be entered in a separate column. In the example below it is the values in Column C that are used to drive the model calculations, the area to the right is used to store each scenario. In Row 24 the Average employment cost in scenario 1 (column F) is £25,000 and in scenario 2 (column G) is £23,000 etc.
At the top (cell C3) the scenario is selected – currently set as 1 and thus all the scenario 1 values in Column F are drawn into the Current values column C. Using this layout, it is possible to store thousands of scenarios across the sheet and instantly pull them into view by changing the number in C3.
There is only one set of workings that can handle all the alternative data sets. Changes to the model are therefore only required once and become immediately applicable to all the scenarios.
Detailed attributes and benefits of the sheet structure:
- Cell C3: This cell is used to select the scenario.
- Column C: Using the =OFFSET formula the selected scenario values can be moved into Column C to drive the model. In cell C23 the formula is =OFFSET(E23,0,$C$3). The function tells Excel to start in cell E23 and then not to move up or down any rows, but to move one column along (the value in C3). Therefore, the offset cell is F23, and its value is displayed in cell C23.
- Column D: The description of the units used for the assumption. This is especially important to inform the user whether a number to be entered in column F onwards is a decimal, a percentage, in whole numbers or thousands, positive or negative, and so on.
- Column F onwards: Data scenarios that can be pulled into column C to drive the model with alternative assumptions.
- All the yellow areas are coloured to indicate they are input cells, thus when the sheet is complete all the non-coloured cells should be locked so that formulae and text cannot be corrupted.
Dynamic Modelling
A key principle of making a model effective is to structure it as a ‘Dynamic model’ which means that a change in any one assumption will always generate a valid answer. This is opposed to ‘Attribute modelling’ where assumptions are independently generated for each attribute of a model.
A Dynamic model uses ratios whereas Attribute modelling uses values. For example, the number of salespeople in the business. This could be entered as a value (Attribute modelling) or entered as a ratio to the number of customers (Dynamic modelling) and thus as the number of customers is flexed the number of salespeople automatically flexes as well. Dynamic modelling ensures that as any assumption changes the final answer is valid. The problem with Attribute modelling is that when one assumption changes potentially a whole series of other assumptions also need to change before a valid answer is generated. Of course, if some assumptions are not changed appropriately an invalid answer is generated that can create a false conclusion.
With Dynamic modelling assumptions you may need to use ‘Floors’ and ‘Ceilings’ in addition to the ratio. Continuing our Salespeople example, we may use a ‘Floor’ to define the minimum number of salespeople, this might be set to 3. So, for scenarios with small numbers of customers there is not an unrealistic number of salespeople being used in the model.
To get the Floor to work use =MAX(Floor value, calculated ratio value). =MAX will take the higher of the two values in the formula.
A Ceiling is a Maximum value which might be required for scenarios where there are capacity constraints such as a hotel or restaurant.
It may also be helpful to use the function =ROUNDUP(value, decimal places) with the ratio calculations, so any fractional values are rounded up to the next whole number. So, in our salespeople example if the calculation resulted in a value of 7.4 people being required to serve our customers, then we should use 8 in the model. The function =ROUNDUP with decimal places set to 0 would enable this to be competed in the Workings of the model.
- The first step in creating a Dynamic model is to identify the factors that determine the scale of activity in the model - this is typically the volume driver for the business such as units or customers.
- The second step is to define the assumptions for the volume driver in terms of an initial ‘Seed’ value (at month 1) and a ‘Behaviour’ that will develop over time (flat, growth, decline, step etc).
- The third step is to link all the other assumptions to this volume driver by ratios - hence as the volume changes so will all the other factors that are related.
Multiple Scenarios
Building a going concern model requires making assumptions about the future. It is impossible, perhaps futile, to try and predict precise future values. It is certainly not a good use of time to continually try and refine a single point estimate.
When working with the future it is much easier to estimate a range over which the value is likely to fall. Take for example inflation twelve months from now – there are wide variations in Government forecasts based on the impacts through the economy of volatile energy prices that resulted from the current international conflicts.
So instead of estimating inflation to be a single value of say 8%. It is easier to select a range where it will lie say between 5% and 10%. With a defined range Excel can be set up to choose a random point within that range. Every time F9 (recalculate) is pressed a new random number is generated and a new inflation value is calculated. In a matter of moments, a huge number of scenarios can be explored each with a new inflation assumption. Testing multiple inflation values will reveal how vulnerable the business might be.
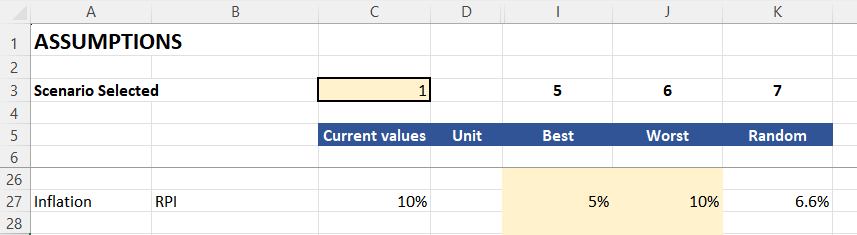
In the example above the layout is the same as shown previously. In columns I and J are the range boundaries. Column K generates the random point between the ranges. The formula below in K27 is:
=(RAND()*(MAX(I27:J27)-MIN(I27:J27)))+MIN(I27:J27)
This may look over engineered, but it ensures that it still works even if the user has put the high and low values the incorrect way around. The =MAX and =MIN in the middle calculates the range. The =RAND() generates a random number between 0 and 1. Multiply this random number by the range and then add the result to the smallest value.
This process can be applied to all the assumptions - sales, interest rates and the ratio assumptions for costs and assets . With all the assumptions being set within valid ranges and continually pressing F9 the breadth of possible outcomes will be revealed. The higher the number of scenarios revealing a positive outcome the more confidence you can have in being a viable going concern.
Should many of the results reveal business vulnerability a model structured in this way can be used to test out minimum viable values. For example, if the business sales growth range is set at between -5% to +5% and a high proportion of the scenario results look disastrous then defining the minimum growth value to stay solvent would be a useful factor to identify. The board debate then focuses on compiling the evidence that each of these minimum factors can be exceeded. Therefore, you will have clearly defined success criteria which is a lot more substantial than simply hope.
Be careful with this range technique as it is only appropriate if you have developed a Dynamic Model which allows you to change any value and always generate a valid answer.
Archive and Knowledge Base
This archive of Excel Community content from the ION platform will allow you to read the content of the articles but the functionality on the pages is limited. The ION search box, tags and navigation buttons on the archived pages will not work. Pages will load more slowly than a live website. You may be able to follow links to other articles but if this does not work, please return to the archive search. You can also search our Knowledge Base for access to all articles, new and archived, organised by topic.