Introduction
What Dynamic Arrays can do
There are valid reasons to consider replacing certain PivotTables with Dynamic Arrays. Of course, one of the most significant drawbacks of using PivotTables is the need to remember to refresh the PivotTable whenever the source data is changed. For many people, the issues associated with clicking on the Refresh button are insurmountable and prevent them exploring not only PivotTables, but also Power Query. Because Dynamic Arrays are just like normal Excel formulae but better, they can recalculate automatically based on the calculation dependency chain, ensuring that they are recalculated every time their source data is changed, without any need for manual intervention.
It is indeed possible to recreate many PivotTable functions using Dynamic Arrays as Liam Bastick showed way back in 2018 when he introduced the new Dynamic Array feature: Modelling 101: Part 41 – Getting Arrays: Spilling the Beans on Seven New Functions. Towards the end of the article he showed how to create a simple PivotTable using Dynamic Arrays to extract the data from an Excel Table.
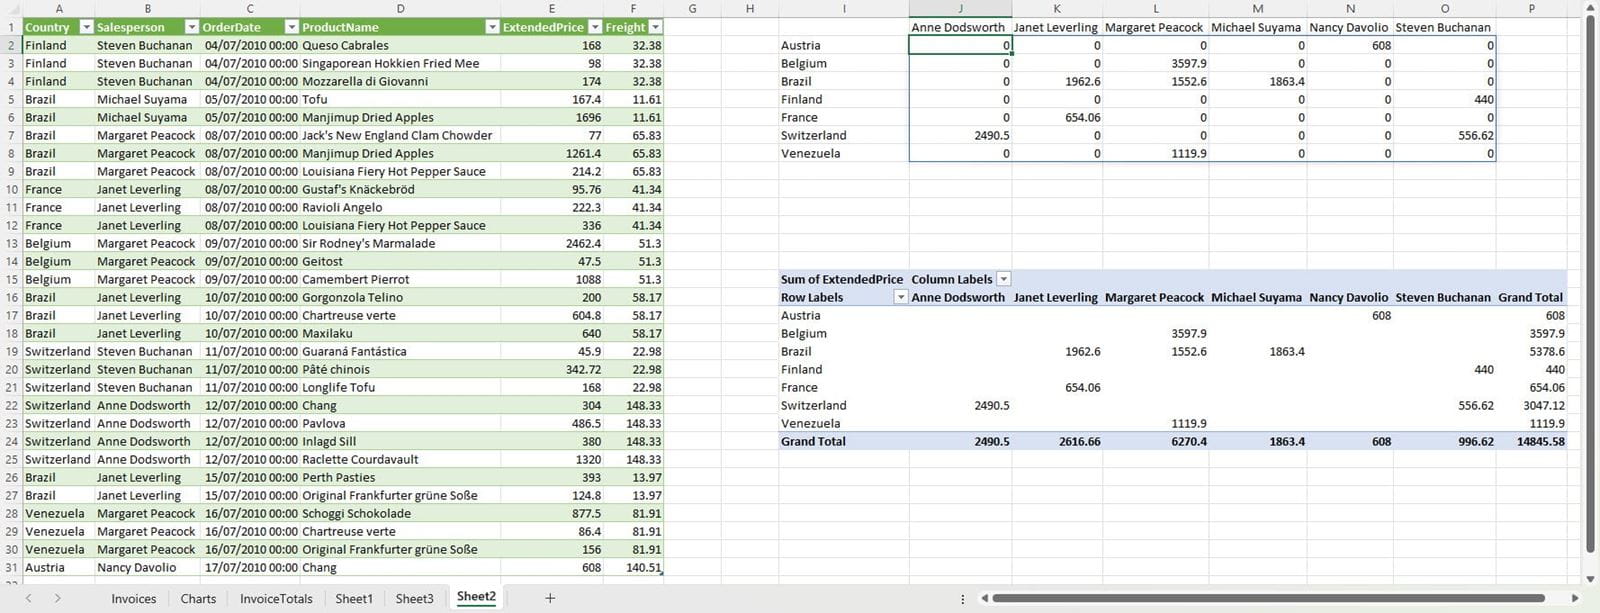
In the following example, we will use Dynamic Arrays and Dynamic Array functions to reproduce a simple PivotTable summary based on our Table of invoice data. We want to create a table that summarises sales by country and by salesperson:

We just need three simple formulae that employ Dynamic Array techniques to achieve this. Our list of countries is created with the following formula in cell I2:
=SORT(UNIQUE(Invoices[Country]))
The UNIQUE() function eliminates all duplicates from the Country column in the Invoices Table, leaving us with the list of countries for which we want to calculate summary totals. We have also used the SORT() function to sort our results alphabetically.
Our list of Salesperson names is similar, but uses the TRANSPOSE() function to convert our column into a row, starting in cell J1:
=TRANSPOSE(SORT(UNIQUE(Invoices[Salesperson])))
Our third formula calculates our totals and is entered in cell J2. It uses the SUMIFS() function with the # operator used to extend it to the number of rows in our countries list and the number of columns in our salesperson names list. You can think of a PivotTable as being just a collection of filters applied to the values in a column. For a simple PivotTable such as ours, each value cell is filtered by the value in the label column and the value in the label row.
SUMIFS() applies this behaviour to the ExtendedPrice column by applying filters based on the Country column being equal to each of the values in column I of our table, and the Salesperson column being equal to each of the values in row 1 of our table:
=SUMIFS(Invoices[ExtendedPrice],Invoices[Country],$I2#,Invoices[Salesperson],J$1#)
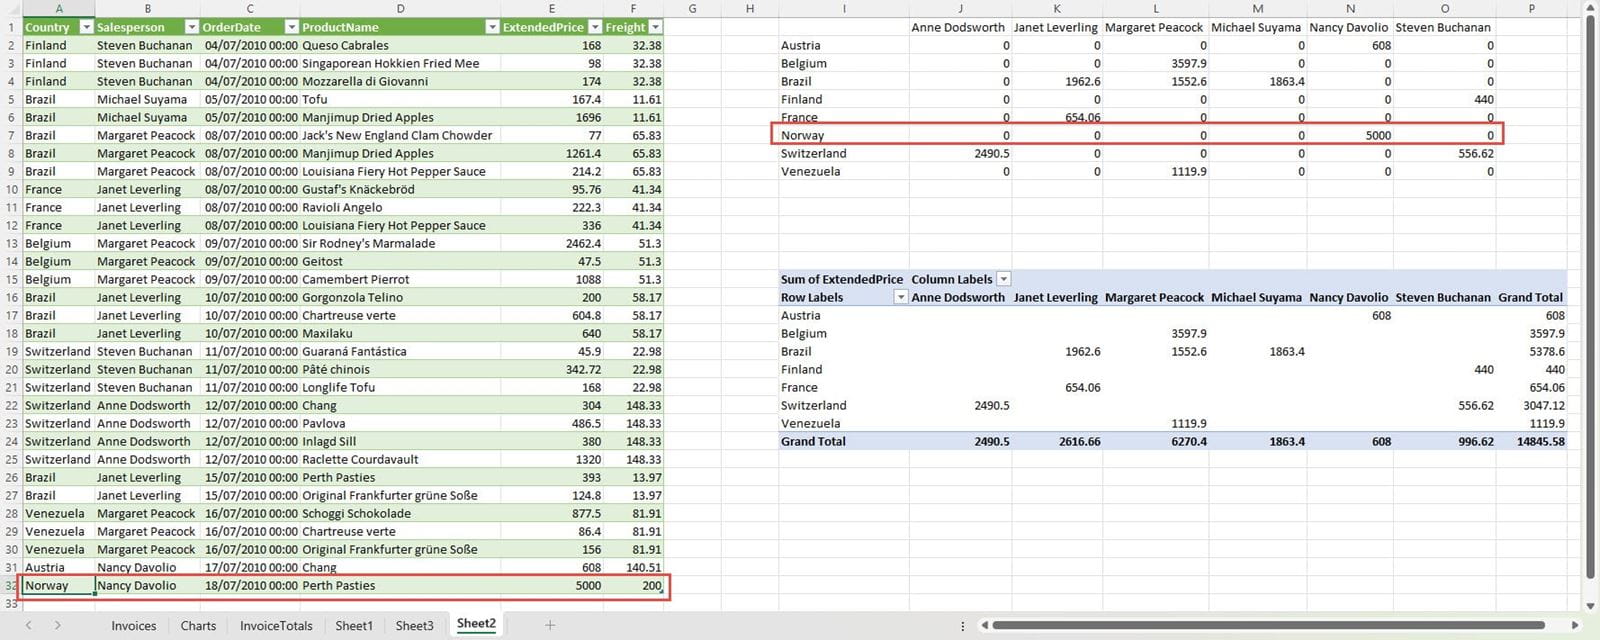
It might seem that the PivotTable alternative is a great deal quicker and easier. All you have to do is to select any cell in the Table, choose PivotTable from the Insert Ribbon tab, Tables group and then click on the Country Field check box and the ExtendedPrice check box and drag the Salesperson field to the Columns area. It takes about 20 seconds with no need to use any functions or even any formulae. However, the massive advantage of Dynamic Arrays is apparent when we add a row to our source Table:

The summary of our new row appears automatically in our Dynamic Array table but is nowhere to be seen in our PivotTable. We would have to right-click in the PivotTable and choose Refresh to update it. Of course, if set up in the right way, a PivotTable can be automatically refreshed at an interval down to 1 minute, but this is still not the same as the refresh being triggered every time there is a change in the source data.
As detailed in a previous article on using charts linked to Dynamic Arrays, the refresh issue is not the only advantage of the Dynamic Array method. The chart types introduced in Excel since 2016 do not work with PivotTables but can be based on Dynamic Arrays.
It would only be fair to also list some of the possible advantages of PivotTables:
- Much simpler to set up (as we have seen)
- Much simpler to reorganise and pivot to summarise in different ways and using different fields just by dragging fields rather than editing formulae
- Ability to sort and user complex filters using dropdown options
- Ability to include multiple value fields using different aggregate functions without the need to enter or change any formulae
- Formatting, including conditional formatting, is automatically applied by PivotTable area allowing it to adjust to changes in the organisation of the PivotTable including sorting and filtering
- PivotTable Styles allow entire PivotTables to be formatted with a couple of clicks
- Ability to use Slicers and Timelines as visual filters
- Ability to choose which PivotTables Slicers and Timelines are connected to, allowing PivotTables to be used as the basis of a flexible and interactive dashboard
- Ability to drilldown to display the individual rows that are summarised in a cell
- Automatic date grouping
- Ability to group, and expand and collapse groups
- Ability to extend functionality using Power Pivot
- Ability to connect directly to many different types of data source and combine data from different sources
- Loads more that I’ve forgotten to mention
Only you can decide whether any or all of these are sufficient to outweigh the inconvenience of the Refresh operation.
Of course, this is a personal, deeply ironic and intentionally provocative portrayal of the advantages and disadvantages of PivotTables compared to using Dynamic Arrays. You might well think very differently. If you do, please send us your alternative view and we will be happy to redress the balance:
Archive and Knowledge Base
This archive of Excel Community content from the ION platform will allow you to read the content of the articles but the functionality on the pages is limited. The ION search box, tags and navigation buttons on the archived pages will not work. Pages will load more slowly than a live website. You may be able to follow links to other articles but if this does not work, please return to the archive search. You can also search our Knowledge Base for access to all articles, new and archived, organised by topic.
