Since the Excel Community dismantled its paywall, membership has increased more than tenfold. As part of ensuring that thousands of new members are aware of the key projects the community is responsible for, we are running a series of articles looking at each of the four spreadsheet publications launched over the past 10 years. Each of these projects is supported by series of explanatory articles that form part of the community archive. These articles are tagged accordingly in the archive. In order to facilitate access to the list of relevant articles for each project, we have added bookmarks to our Power BI archive portal, so that the list can be displayed with a single click.
Power BI bookmarks
Most Power BI reports feature a set of tables and other graphics that can be filtered, sorted and highlighted interactively using dropdowns and slicers. Different elements of a report can also be linked to each other so that, for example, clicking on a bar in one chart will filter or highlight other charts so that they show the same subset of information. We will use our archive portal for our examples. Here, we have clicked on one of the bars in the competency level chart (outlined in blue), and we can see our other charts (outlined in green) now highlight information related to articles that have been tagged with the same level. In addition, our list of articles and other graphics are filtered to just the ‘General’ level content: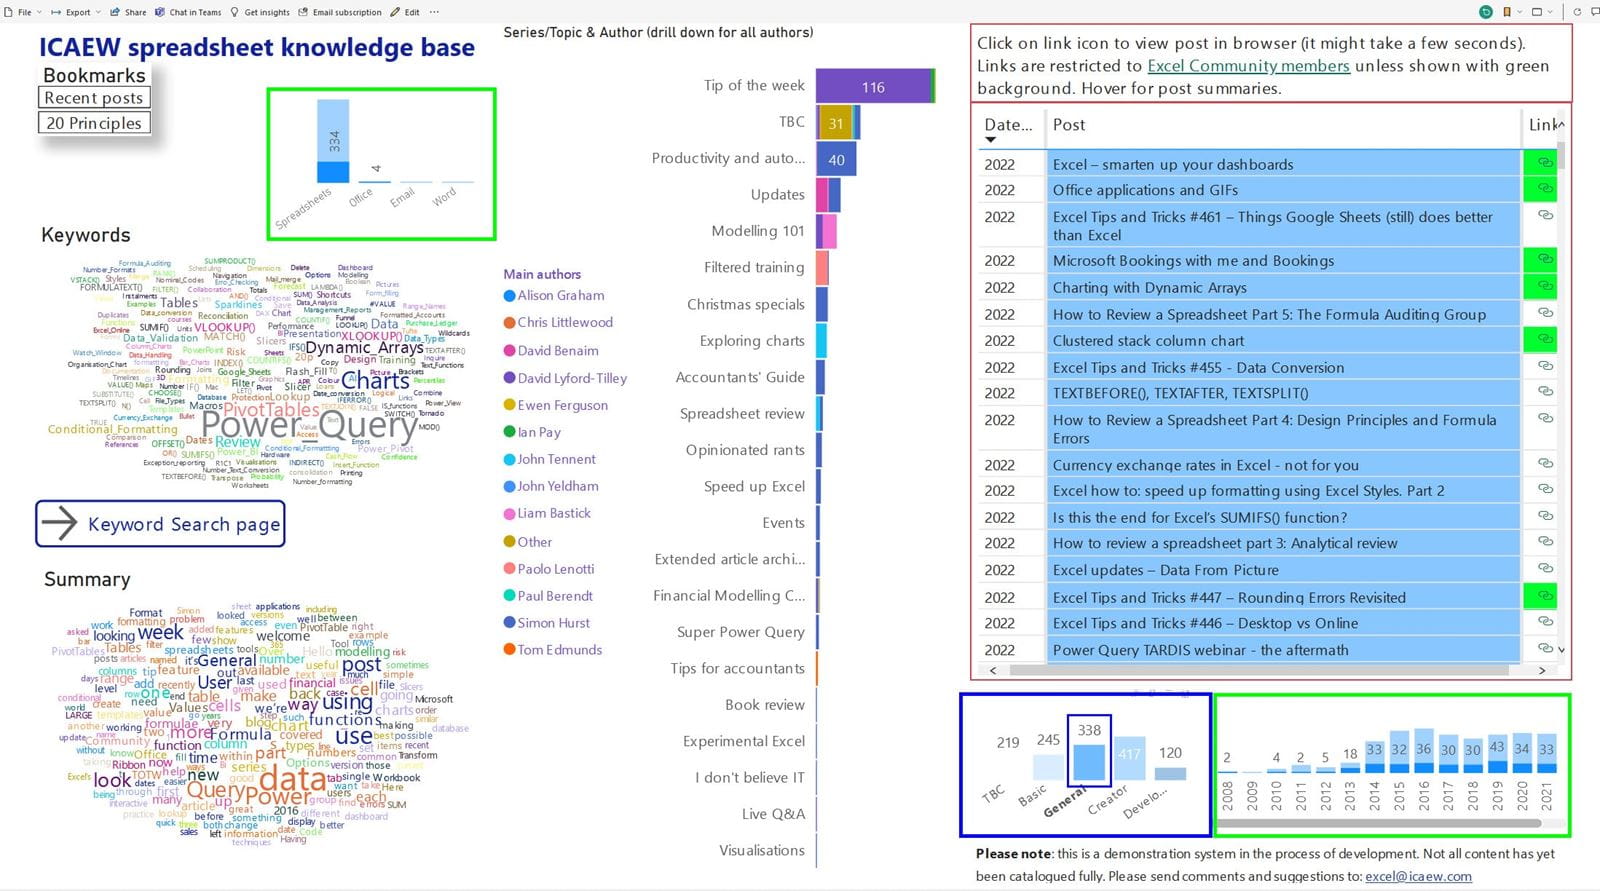
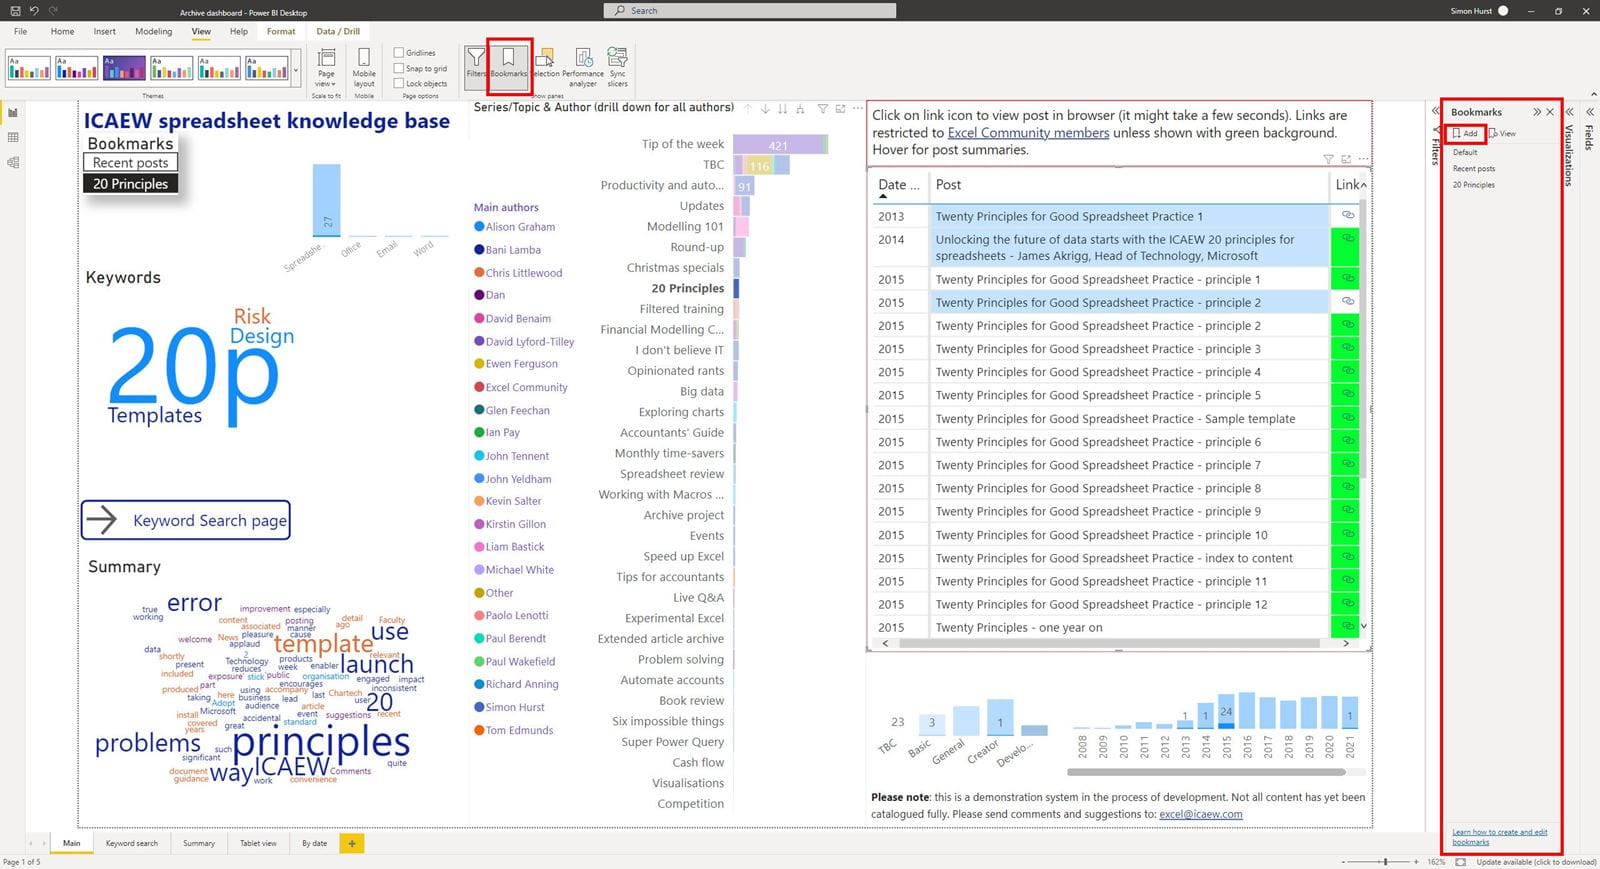
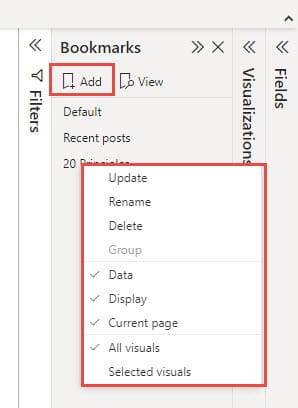
Our bookmark saves the state of all of these filters so that they can all be applied just by selecting the associated bookmark. As well as filters, bookmarks will also save the state of sorts, drill locations, object visibility as set in the Selection pane, and the focus and spotlight mode of objects.
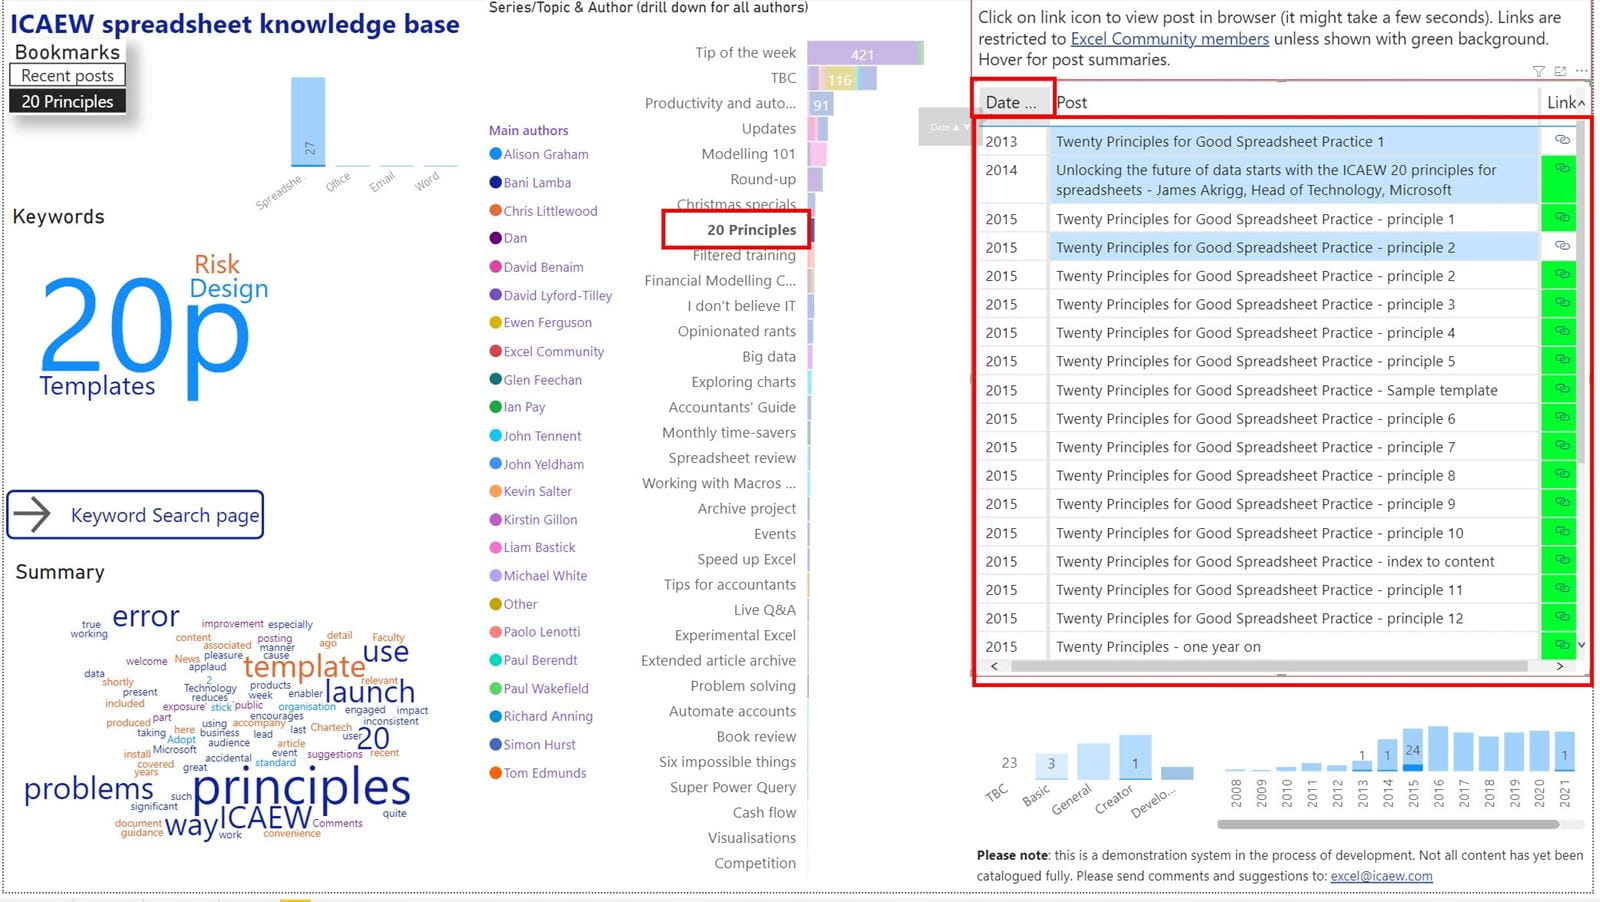
For the archive portal, we want to display articles in the 20 Principles series and we want to sort them in chronological order:
Bookmark Navigator
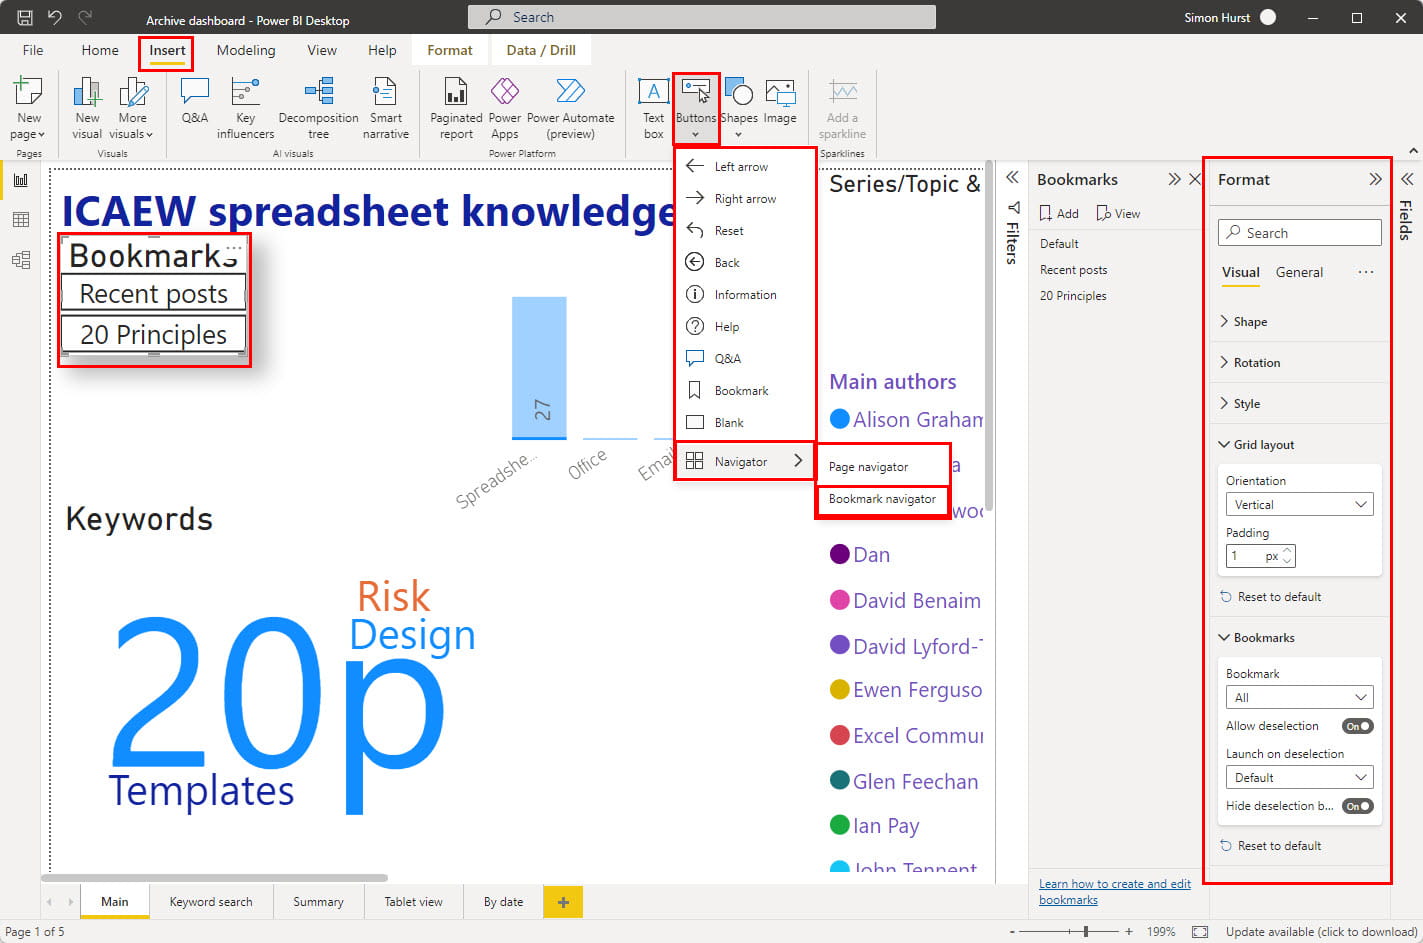
Once we have our bookmarks set up, we can make them easier to access by allocating a bookmark to a button on our page. Clicking on the button will apply the bookmark settings. This would be fine if we only needed a fixed bookmark or two, but if we are planning on changing or adding bookmarks over time, this would require bookmark buttons to be added or changed manually each time. A more automatic method is to set up a Bookmark Navigator.To do this, we can go to the Insert Ribbon tab, Elements group and click on the Buttons dropdown. As well as the individual Bookmark option, at the bottom of the dropdown the Navigator option lets us choose a Page navigator or a Bookmark navigator. Both are similar in that they create a block of buttons for each page or bookmark. This block is updated automatically as we add, delete and rename pages or bookmarks. The Navigator block is added to our report page just like any other Power BI visual and, when selected, can be edited using the options in the Format pane.
For example, here we have inserted a Bookmark navigator and used the Grid Layout section of the Format, Visual pane to choose to display the buttons vertically and with reduced padding. This helps us to create a relatively compact block of buttons to select each of our bookmarks. We have also created a ‘Default’ bookmark by adding a bookmark when our report page has no filters set and with the list of articles sorted in reverse chronological order. In the Bookmark section of the Format, Visual pane we can turn on ‘Allow deselection’ and set this Default bookmark as the bookmark to be ‘launched’ when all the other bookmarks are deselected. This gives us an easy way to go back to our normal display of the report page:
We haven’t included a list of links in this article, but you should find a Power_BI ‘word’ in the keyword word cloud that you can click on to display articles relevant to the use of Power BI.
Archive and Knowledge Base
This archive of Excel Community content from the ION platform will allow you to read the content of the articles but the functionality on the pages is limited. The ION search box, tags and navigation buttons on the archived pages will not work. Pages will load more slowly than a live website. You may be able to follow links to other articles but if this does not work, please return to the archive search. You can also search our Knowledge Base for access to all articles, new and archived, organised by topic.

