Simon Hurst yet again claims that Power Query can change your life and attempts to prove it in a live webinar. This is the first of two posts dealing with the questions that the webinar provoked.
The recording of the latest Excel Community webinar 'Power Tools Part 1: Why Power Query can change your life' is now available, together with the supporting workbook. The webinar generated lots of questions and this first article is intended to cover some of the more straightforward ones. If your 'Power Tools Part 1' question is not covered this time, hopefully we will drill down into it in the next article on the webinar which will be part of the 'Your Questions Answered' series.
Admin
Possibly the most popular question related to the availability of the webinar recording and the associated workbook. Both are now available using the link in the previous paragraph. It is mentioned in the introductory page but it's worth emphasising that the closed captions are generated automatically, and couldn't always cope perfectly with my downtown Croydon drawl.
The Excel camera
A brief use of the Excel Camera – to include the contents of a dashboard sheet as an overlay in the sheet containing the data upon which the dashboard was based – generated a few questions and gasps of astonishment (at about 25 minutes into the video):
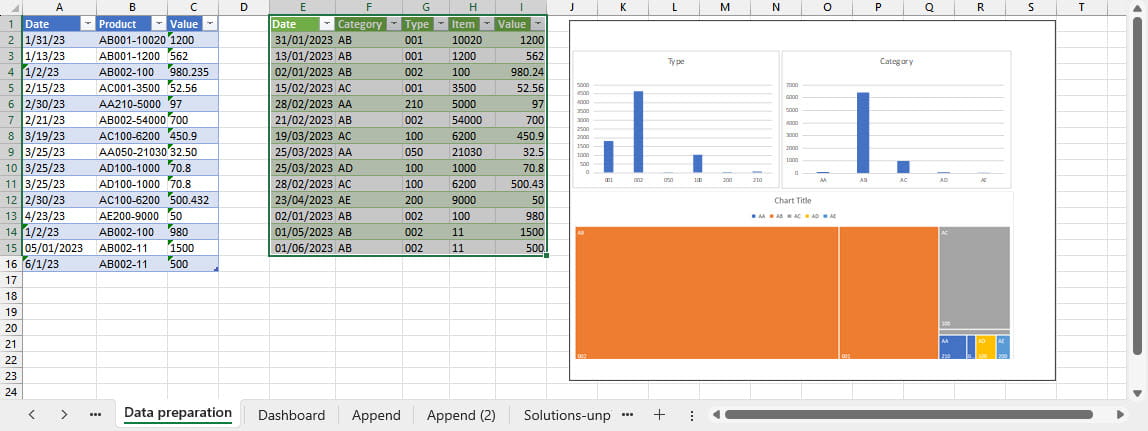
I did have a few minutes at the end of the webinar to clarify that the camera picture is live and immediately reflects any changes in the original cells, but if you are interested in the Excel Camera or other methods of creating a Linked Picture, these archive posts might also be of interest:
- Traffic cameras - incorporate real traffic lights in your Excel reports
- Turning the tables on Linked Pictures
One of the questions regarding the use of the Camera and Linked Pictures concerned whether the picture stayed 'live' when inserted in another application such as PowerPoint. As far as I've been able to discover, the Linked Picture does not work across applications. It is possible to insert a linked object into another application that gives a similar end result (copy cells in Excel, go to say PowerPoint, use Clipboard, Paste dropdown, Paste Special, Paste link, Microsoft Excel Worksheet Object):
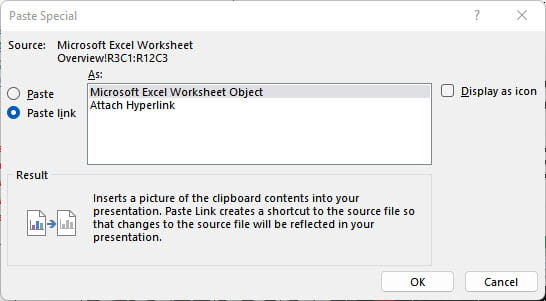
However, this is an actual link to potentially the entire workbook rather than just a picture of a few cells, so would need to be used with great care and consideration for confidentiality. If anyone does know a way to include a live, linked picture of an Excel workbook in another application please let us know: excel@icaew.com
Working with multiple tables/data sources
Ways of working with more than one table of data, whether that be in a single workbook or across multiple external data sources, featured in several questions. In this webinar, we combined data in three Excel Tables by referring to each one individually. This would require manual intervention should it be necessary to add further Tables. It is possible to make the process automatic, for example by using an entire folder, rather than an individual file, as the data source. Power Query can then include any new files added to that folder automatically. A previous Power Query webinar used this method to fully automate the production of monthly accounts from basic trial balances held in separate Excel workbooks:
- Experimental Excel - look, no formulae
Another question asked "do the files in the folder have to be formatted in the same way ie, same table headers, or specified ranges?"
Ideally, each table of data would be structured in the same way with the same number of columns, in the same order and with the same purpose. However, Power Query does have a range of features that can rearrange data, so it is often possible to cope with differences in data structure, as long as there is some identifiable logic that can be applied. For example, if you were appending tables that had different column names, Power Query would create multiple columns:
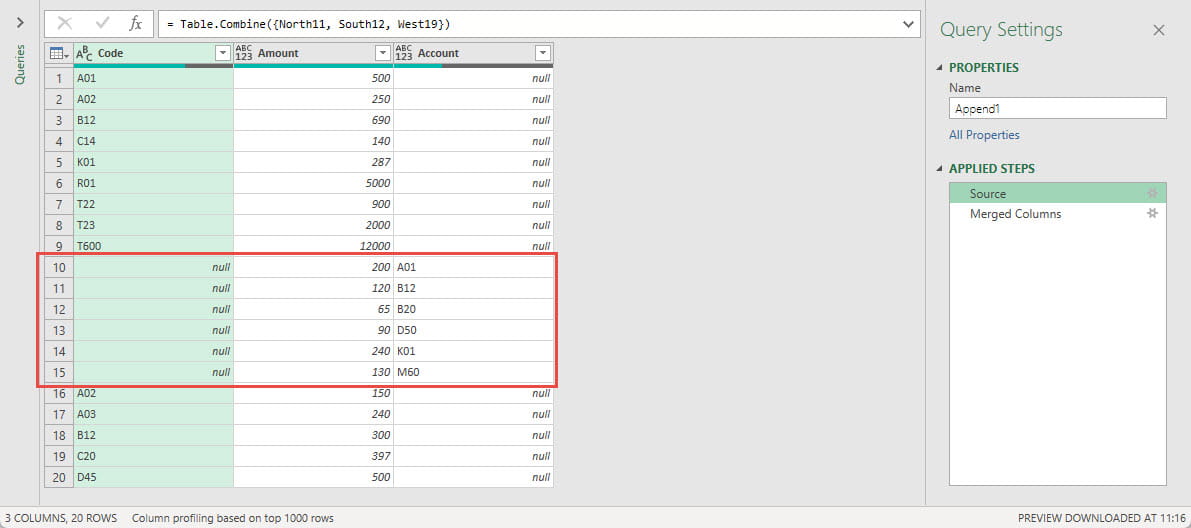
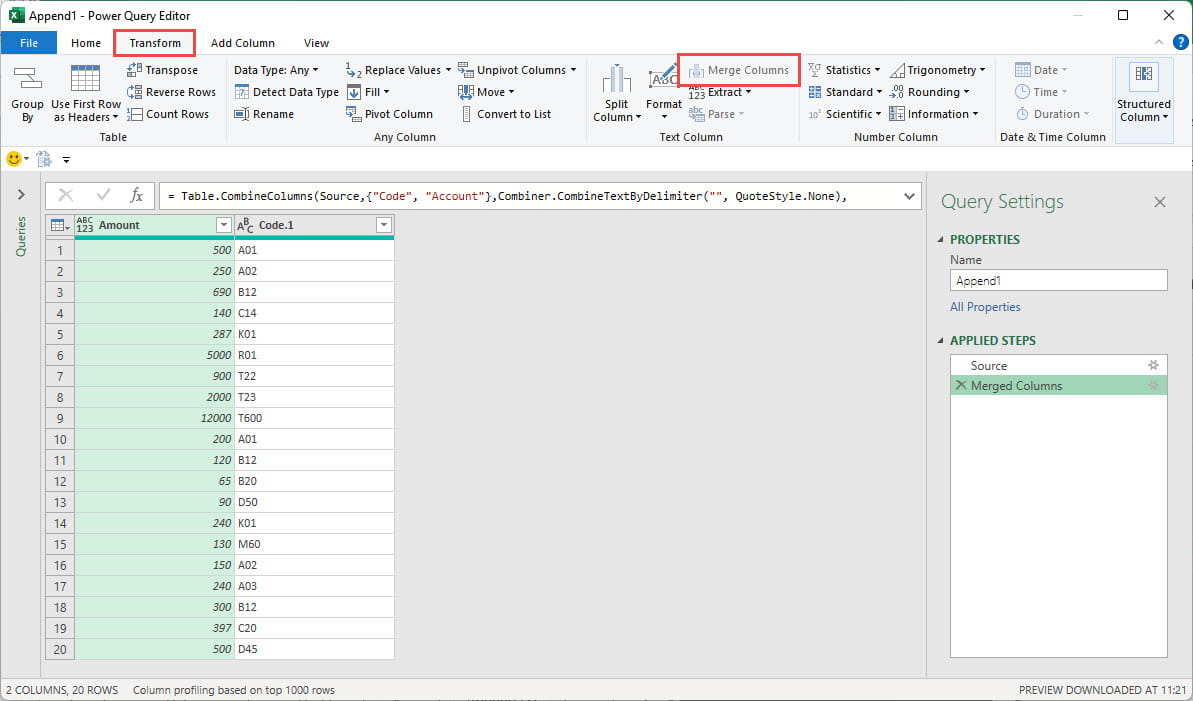
The tables that had no column headed 'Code' would have null values for the Code column and vice versa for tables that used the heading 'Account' rather than Code. We could select our two columns and use the Merge Columns command in the Transform Ribbon tab to combine them into a single column. Because one of each pair of columns would always have the value null, this will give us a single column of account codes:
Getting started with Power Query
This webinar focused on showing what Power Query could do, rather than being a step-by-step introduction in how to use Power Query. For a more introductory approach the following webinars might also be useful:
- Power Query - the Excel TARDIS (Totally Avoid Running out of Dimensions In Spreadsheets) (2022)
- Introduction to Power Query (2020)
- Webinar: Power Query - how to get started (2018)
There are also many articles in the community archive on Power Query. The best way to browse through them is probably to go to the Power BI archive Portal and select Power_Query from the Keywords word cloud. You can then either look through the various Power Query series, or the chronological list of posts:
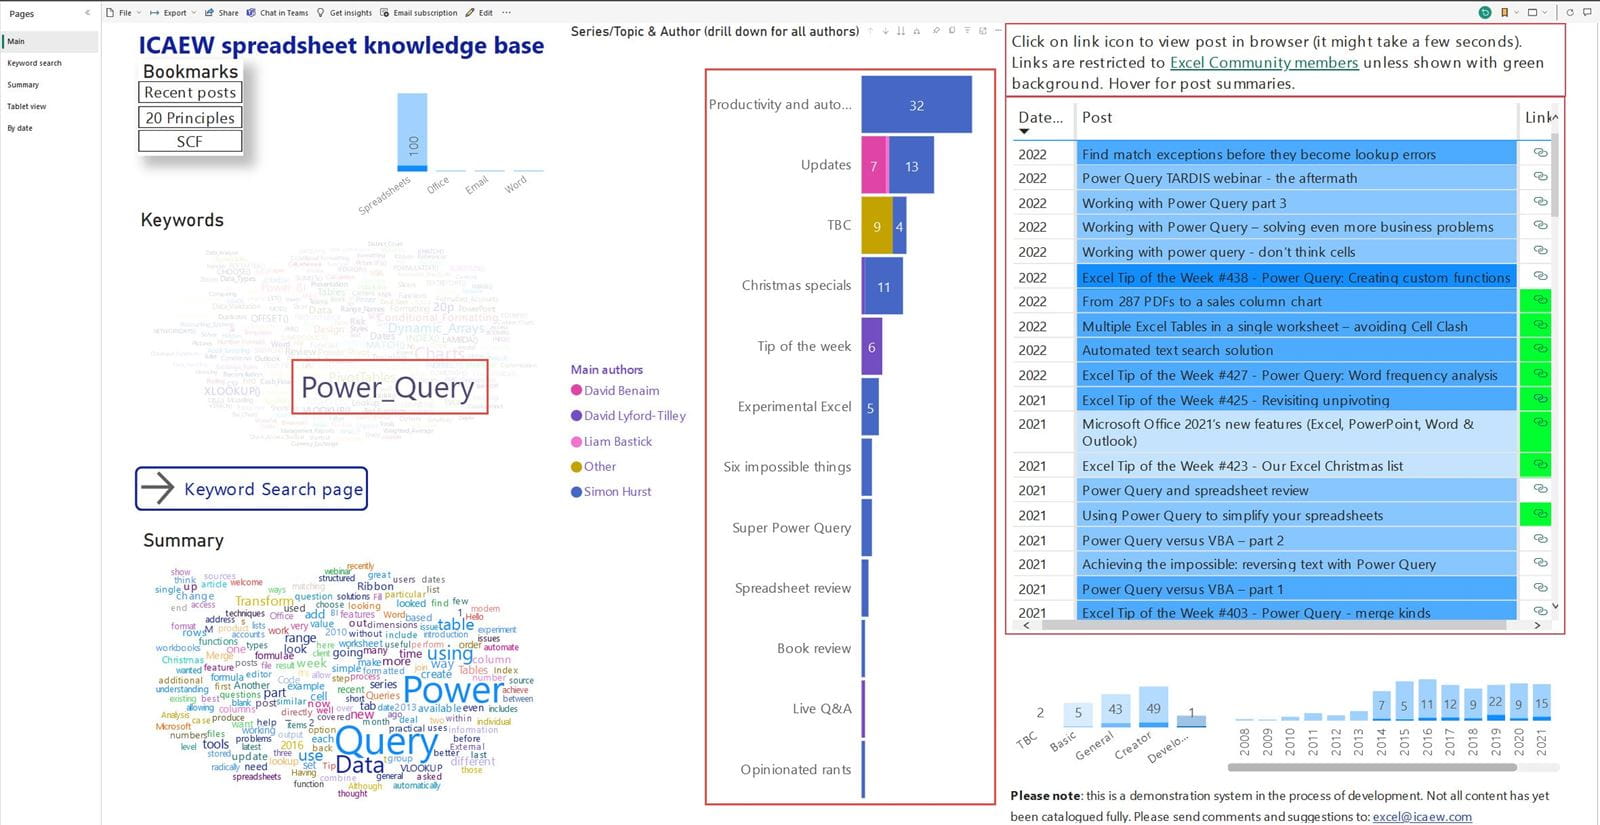
The 'Open in full-screen mode' icon in the bottom right-hand corner of the embedded report should show the contents at a more readable size with the Escape key returning you to the post.
Next time
In the next post, we will be looking at lots of further questions that came out of the webinar, including how to use one query as the starting point for another query, working with dates and instalments, file size issues and how Power Query works with formulae in Tables.
Archive and Knowledge Base
This archive of Excel Community content from the ION platform will allow you to read the content of the articles but the functionality on the pages is limited. The ION search box, tags and navigation buttons on the archived pages will not work. Pages will load more slowly than a live website. You may be able to follow links to other articles but if this does not work, please return to the archive search. You can also search our Knowledge Base for access to all articles, new and archived, organised by topic.
