In his first article for the Excel community, Mark Proctor explores how to apply the basic principles of First Normal Form to Excel to reduce the complexity of working with data in spreadsheets.
Normalisation is a process that improves the efficiency of how databases hold data. It reduces duplication and improves integrity, making data easier to work with.
There are different levels of normalisation, where efficiency benefits improve with each subsequent level. The most basic level is known as First Normal Form (1NF).
As I am sure you have heard many times, “Excel is not a database”. As a result, we cannot apply the full database normalisation process to data held in the grid of an Excel spreadsheet.
However, we can apply the basic principles of 1NF to Excel. Doing so, reduces the complexity of holding and calculating on data within a spreadsheet.
So, let’s discover how we can use and apply 1NF in Excel.
What is First Normal Form (1NF)?
So, what is 1NF? And why is it so important? For data to be in a 1NF layout it must be structured in a specific way, meeting certain rules.
The rules are as follows:
1. All elements must be single valued
The values in each column must contain a single value and not a combination of values.

As shown in the screenshot above, breaking Units and Size into separate columns makes the data easier to work with.
2. Data types of columns must not change
The values stored in a column must be the same type or kind.

In the screenshot above, while Units and Value are both numbers, we cannot aggregate or group those values in a meaningful way. Therefore, the values are of different kinds.
1NF would require us to use different columns for Units and Values.
3. Every column must have a unique name
Columns are referred to by name and not position; therefore, column names must be unique.

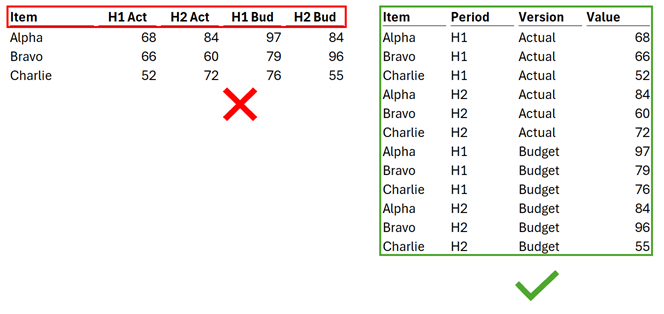
As shown in the first image above, H1 and H2 are not unique column names, they are repeated for Actual and Budget.
To comply with 1NF we would need to flatten the multiple header rows to a single row to create unique column names.
4. The order of data does not matter
In 1NF, the order of rows and columns is irrelevant. If rows or columns change order, it should not impact on our ability to use the data.
This means any ordered and grouped layouts are not acceptable; also Merged Cells definitely do not have a place in our data.

In the left screenshot above, if the columns were presented in a different order (for example, H2 Bud, Item, H2 Act, H1 Act, H1 Bud), would we still be able to calculate correctly?
Generally, categorisation and order make calculations position dependent. Therefore, the likely answer to the question above is, No.
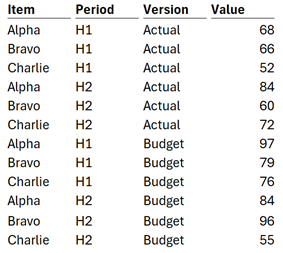
Using 1NF, data does not have a position. In the right screenshot above we could mix up the column order, or the row order and it would have no impact on our ability to use that data.
What impact do the 1NF rules have?
The 1NF rules change how we record and use data.
When using 1NF, each row is a separate record or event. Each attribute (known as a dimension) about the record is contained in a separate column.
This leads to data structured in a vertical orientation with separate attribute/dimension columns (see example below).

Does 1NF really help us in Excel?
If a spreadsheet holds data in 1NF, it reduces the complexity of working with that data. In fact, many of Excel’s features are designed to work with 1NF.
Let’s look at some examples:
PivotTables
If we try to create PivotTables with data not in 1NF we are likely to meet error messages, or Excel automatically changes column names for us.
This occurs because PivotTable expect data in 1NF.
Tables
Tables only have a single header row. If we try to provide duplicate column names, it changes other column names to prevent the duplication.
Through this, we see Tables behaving as data objects expecting the data to be in 1NF.
Functions
Some Excel functions, such as DSUM, DCOUNT etc, are specifically designed to work with data held in 1NF, but they are rarely used.
Many other functions are flexible and can work in either horizontal or vertical orientations, but not both at the same time. For example, SUMIFS is perfect for calculating on data in 1NF, but cannot calculate on values held in both horizontal and vertical orientations at the same time.
The default arguments for functions such as UNIQUE and SORTBY assume data is in a vertical orientation, much like 1NF.
While Excel can perform matrix calculations across data in horizontal and vertical orientations at the same time, to avoid formula complexity it is best if the data is held in a single orientation (eg, exactly what we find with 1NF).
First normal form reduces formula complexity
If you’re still not convinced, why 1NF is important, let’s take a look at an example.

In the screenshot above, we have a table holding data for Q1-Q4. The data is contained in three orientations:
- Vertical (Item – Alpha, Bravo, Charlie)
- Horizontal (Quarters – Q1, Q2, Q2, Q4)
- Grouped Horizontal (Version – Budget, Actual)
This is common format for receiving input from other Excel users.
Let’s suggest we want to calculate the average value of the Items for the quarter specified in cell L2, and the version specified in L3.
Our formula would need to be similar to the following:
=SUMPRODUCT(B3:I5*(SCAN(B1,B1:I1,LAMBDA(state,current,IF(current=0,state,current)))=L2)*(B2:I2=L3))/ROWS(A3:A5)
Don’t worry, you don’t need to understand the formula, just appreciate how complex it appears.
Or maybe we could use another solution:
=AVERAGE(FILTER(B3:I5,(SCAN(B1,B1:I1,LAMBDA(state,current,IF(current=0,state,current)))=L2)*(B2:I2=L3)))
Again, you don’t need to understand this formula, just see how complex this is.
Even though we had an input which appeared to be in a simple layout, we need many complex formulas, or manual interventions to deal with it.
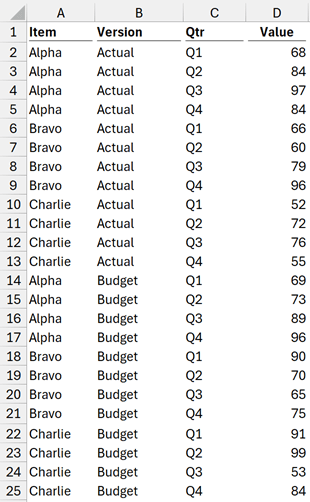
Now let’s, get the same input into a 1NF layout.

With this structure, we can calculate the same value easily with a single AVERAGEIFS function.
=AVERAGEIFS(D2:D25,B2:B25,L2,C2:C25,L3)
By comparison, that is a very easy formula (it only contains a single function!)
With 1NF, it does not matter how many dimensions/attributes are added, the number of orientations remain the same. Therefore, we can continue to use the same easier formulas.
Hopefully, this simple example illustrates how 1NF allows us to use easier formulas.
What if the input is not in 1NF initially?
Unfortunately, inputs come in all shapes and sizes, often dictated by the software or the spreadsheet creator. Therefore, we simply don’t have the luxury of receiving everything in 1NF.
This is where Power Query steps in. It is a tool, that has been natively available in Excel since 2016. The primary purpose of Power Query is to reshape inputs into their ideal format for calculation. More on this tool has been covered in an introductory webinar on Power Query.
Based on the examples above, we have seen 1NF is often the ideal format. Therefore, there is no longer a reason to fight with complex formulas. We should use Power Query to reshape the input into a 1NF layout to allow for easier calculations.
Not only that but Power Query:
- provides output in a Table format:
- ensuring calculations are not broken if column orders change.
- formula ranges automatically expand for new data, so we never need to update formulas for new data.
- connects to and combines multiple data sources, removing the need to copy and paste inputs between workbooks.
Conclusion
In this post we have seen how 1NF provides a data structure which is easy to work with in Excel. Therefore, rather than upping your formula game, it’s probably time to up your data preparation game.
By getting data in the right format at the start (using Power Query) you can avoid many complex formulas and simplify your Excel workbooks.
Archive and Knowledge Base
This archive of Excel Community content from the ION platform will allow you to read the content of the articles but the functionality on the pages is limited. The ION search box, tags and navigation buttons on the archived pages will not work. Pages will load more slowly than a live website. You may be able to follow links to other articles but if this does not work, please return to the archive search. You can also search our Knowledge Base for access to all articles, new and archived, organised by topic.

