
Inspired by the treatment of numbers on TV during the general election coverage, this article tries to demonstrate how something as simple as number formatting in Excel can deliver significant benefits for clarity.
It’s not about the politics (or just the BBC)
First of all, reassurance that this post has nothing to do with politics itself. Accepting that other broadcasters and forms of media are available, I tend to watch the BBC news. Over the past few weeks, there has been a great deal of analysis of the various figures included in the manifestos of each of the parties. For me, one of the main points that has stood out is the failure to correctly align the figures in the tables used on the BBC news coverage.
The importance of getting your alignment correct
Obviously, for reasons of impartiality, I will try to minimise any direct references to right or left alignment.
Two examples where the alignment of the numbers displayed on TV fell some way short of optimal spring to mind. In the early days of the campaign, much attention was focused on the Conservative assessment of how much Labour spending plans would mean in extra taxation. The BBC used a table analysing the major spending commitments, split into the different sources of the estimates. At first glance, the bottom group looked as though it only contributed a very small proportion of the total – in single figures of billions. However, looking more closely, the bottom figure on its own was in the tens of billions. Because the other figures in the table displayed the total with a single decimal place whereas the bottom figure was shown with no decimal places, the magnitude of this final figure wasn’t readily apparent.
The second alignment example was similar and related to the spending plans for the Green party. This time, I managed to get a screenshot:

| Health & social care | £52.9bn |
| Income support | £29.4bn |
| Education | £13.6bn |
| Transport | £14.6bn |
| Overseas aid | £24bn |
| Total | £161.6bn |
In addition to the alignment issue, the table doesn’t make it clear that the individual amounts listed are only part of the overall total, adding up to only £134.5bn of the total shown of £161.6bn.
Using the same number of decimal places for each of the figures makes things a lot clearer, and probably also makes it easier to see that the total does not agree with the sum of the individual items:
| Health & social care | £52.9bn |
| Income support | £29.4bn |
| Education | £13.6bn |
| Transport | £14.6bn |
| Overseas aid | £24.0bn |
| Total | £161.6bn |
Excel number formatting
This issue demonstrates the importance of getting the simple things right when presenting tables of figures. As clever as all Excel charting and other graphics features are, just using the most suitable number format can dramatically improve the clarity and impact of a table of figures. It’s also important to consider the assumptions people will make based on the way the figures are presented. Including the total at the bottom, underneath an underline, will suggest to many people that it is the addition of the constituent parts, which clearly is not the case in this example.
Excel includes a range of built in number formats, including ones that use fixed numbers of decimal places and currency symbols. It is also possible to create a custom number format that can control the numbers of decimal places displayed; alignment; how negative values are differentiated; the inclusion of currency symbols and text, and the way in which zero values are displayed:
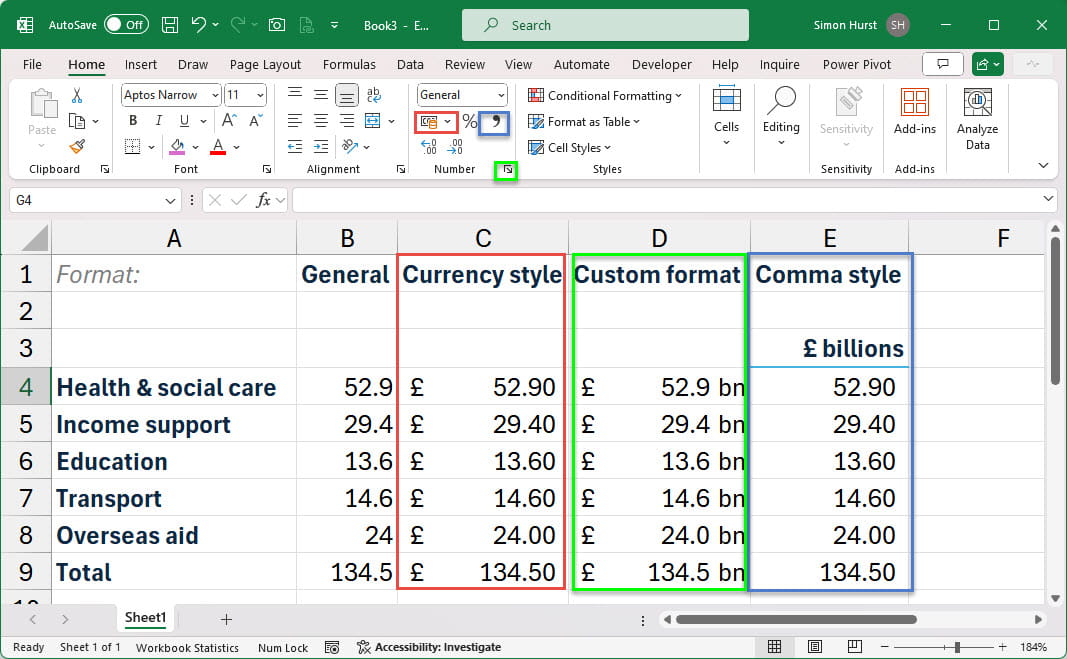
In the case of our Custom format column, this based on the currency style format code, adapted to include the bn designator and a single decimal place:
_(£* #,##0.0_)"bn";_(£* (#,##0.0)"bn";_(£* "-"??_)"bn";_(@_)
Here is a simpler format with zero decimal places; the use of brackets for negatives and a dash for zero values:
#,##0_);[red](#,##0);-?
Links
The subject of number formatting has been covered several times in community posts. These are two of the more recent such posts and they include an explanation of how the formatting codes shown above work:
- Accountants' guide to Excel – mastering number formats part 1
- Accountants' guide to Excel – mastering number formats part 2
You can also explore number formatting and presentation in general in the ICAEW archive.
Archive and Knowledge Base
This archive of Excel Community content from the ION platform will allow you to read the content of the articles but the functionality on the pages is limited. The ION search box, tags and navigation buttons on the archived pages will not work. Pages will load more slowly than a live website. You may be able to follow links to other articles but if this does not work, please return to the archive search. You can also search our Knowledge Base for access to all articles, new and archived, organised by topic.