My top 5
- GROUPBY could be Excel’s Pivot Tables 2.0
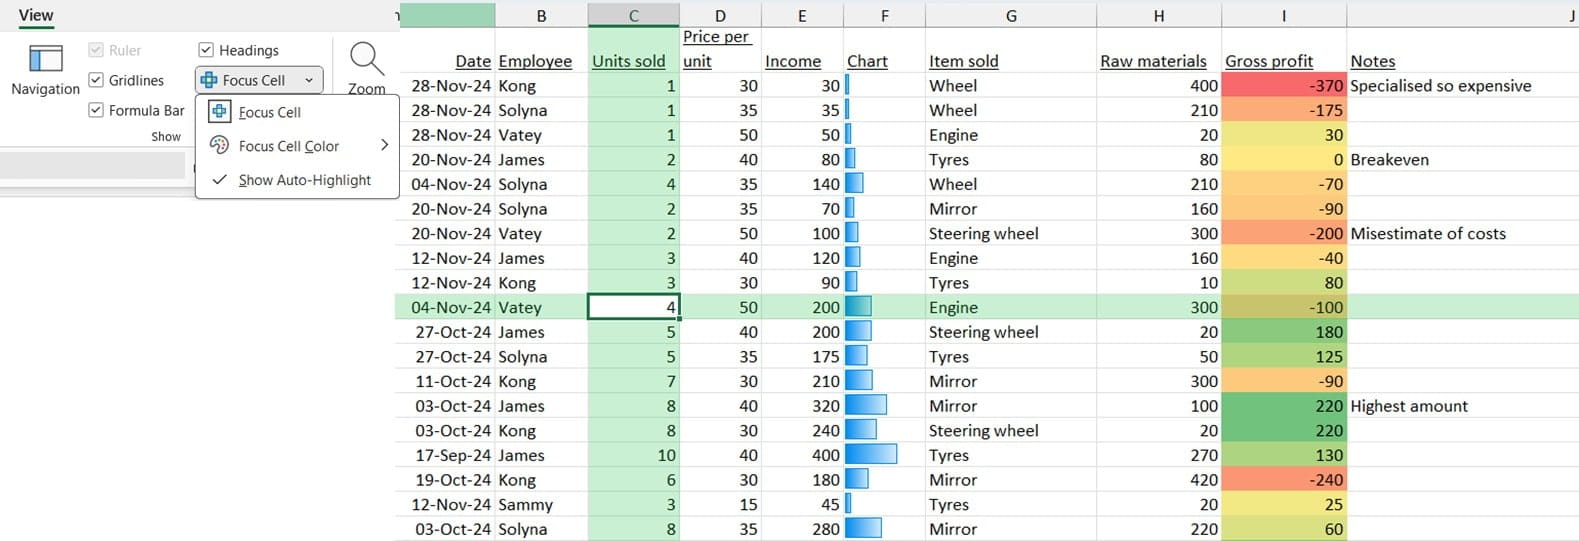
- Highlight the row & column of the active cell with Focus cell
- Randomise data & create QR codes with Excel’s new Python templates
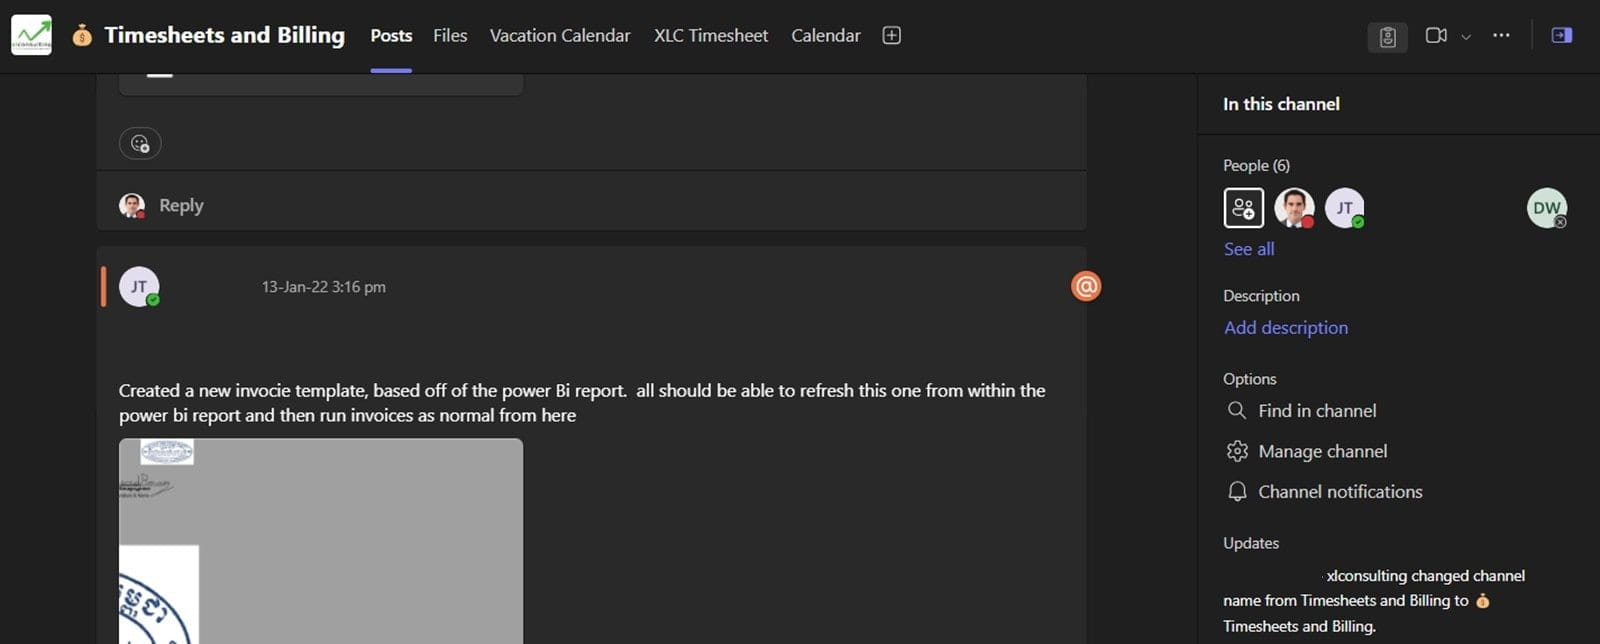
- See a channel details pane in Teams
- Dark mode is enabled in Power BI
Core Office Apps
Excel, PowerPoint, OneNote, Outlook and Word release regular updates to Microsoft 365 Apps and Services. To see or update your version, click File> Account. The Current Channel should now be on version 2410, which is the year 2024 and month 10 (October) with 2411 (November) coming later this month, the Monthly Enterprise channel releases updates a couple of months after the Current Channel. The Semi-Annual Channel received no updates this period so is on 2402 currently. The Insider or Beta features are only available for a small selection of people who sign up to help test features, so they haven’t been reported explicitly, but they give a good idea of what is coming next.
Excel
Excel publishes a digest every month which I am a guest contributor to, here are articles for September, October and November 2024.

Excel Desktop Current Channel only
- GROUPBY function: Create a PivotTable via a function. GROUPBY has 3 mandatory inputs and the rest optional = GROUPBY(row_fields, values, function, [field_ headers], [total_ depth], [sort_ order], [filter_ array], [field_ relationship]). First two inputs are what you would drag into Row and Values fields in a Pivot Table builder. Next select the preferred aggregation function (SUM, PERCENT OF, AVERAGE are most commonly used). I recommend to usually input 3 to show field headers for [field headers] and to type -2 for [sort_order] to sort the 2nd column (values) from highest to lowest, the last 2 inputs are rarely used. Better than PivotTables, these refresh automatically, can create any chart (including map charts), and can aggregate text values into a comma separated list. I talk more about this & PIVOTBY in another ICAEW article I published recently.
- PIVOTBY function: Create a 2-dimensional PivotTable through a formula, inputs are similar to GROUPBY, but you also can add a column field. PIVOTBY(row_fields,col_fields,values,function,[field_headers],[row_total_depth],[row_sort_order],[col_total_depth],[col_sort_order],[filter_array],[relative_to]). I rarely use [field_headers] for PIVOTBY, and final input is rarely used. The video below explains the basics of these functions.
- PERCENT OF function: =PERCENT OF(data_subset,data_all) was released with GROUPBY. It can shortcut a way to create a %. If you put multiple cells in the “data_all”, they get added together and become the denominator of the data subset when calculating the %. More in this video:
- Three new templates based on Python (which was covered in the last blog):
- Getting started with Python: An introductory guide
- Random data generator template with Python: Since Python integration, you can now click File > New and search for “Random data generator”. You can pick which fields to use, and it will generate random data, but each column has unique fields only. Usually when I generate random data for training exercises or mock ups, I need non unique values so I would still need to use some additional formulas to make it work.
- QR code generator with Python: Create funky QR codes with this template by following instructions
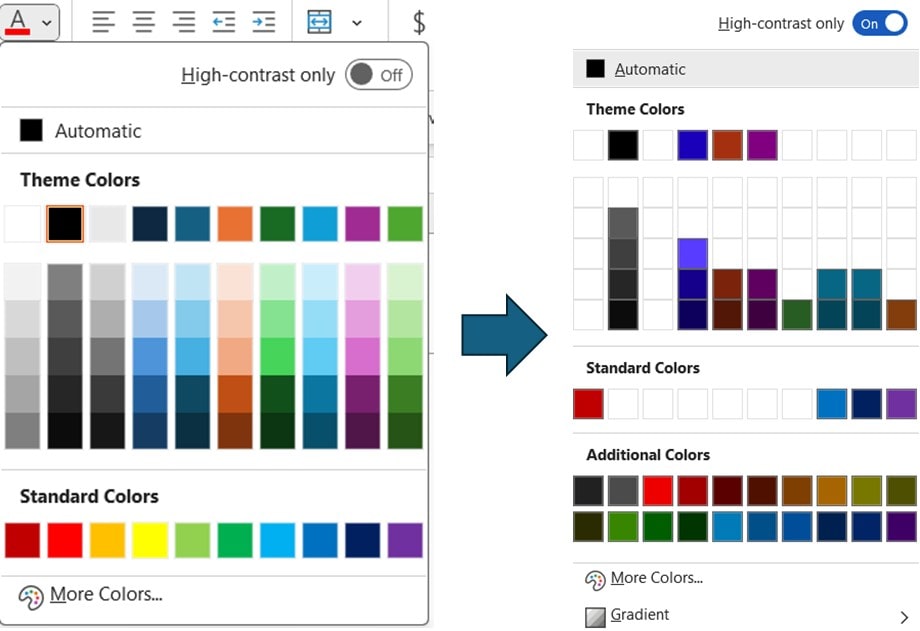
- High contrast colours only: In any colour picker (e.g. font, cell background, chart outline), you will see a useful toggle for “high contrast only”.

- Focus cell: Highlight the cross range of the active cell in a colour of your choice. Toggle this on/off via View Tab > Focus Cell. You have another option for “Show auto highlight” which will set this feature on when using Find & Replace.

- Strikethrough for stale formula outputs when using Manual or Partial calculation mode: Excel released "Partial" calculation mode (Formulas tab > Calculation options > Partial) so that sluggish Python formulas can be manually updated. If using Partial or Manual calculation modes, you'll now see values which have been changed with a strikethrough.

Word
- Filter markups shown for track changes. Previously this was “Show markup” but now has been renamed on the Review tab.

OneNote:
- Loop integration: Click Insert tab > Loop component to add a Microsoft Loop component into OneNote which can thereby be edited in Outlook, Teams, Word Online, Loop itself or other places.
Microsoft Teams:
- New meeting options control participants' ability to admit attendees from meeting lobby
- Upvotes on Q&A in meetings: Users can upvote certain questions, and admins can sort, and filter based on upvotes. Note Q&A must be enabled for each meeting by adding it an app.
- Set your name pronunciation: Open your name profile card from Teams or Outlook then click the microphone.
- See Teams and chats in one screen by going to More channel options icon at the top of your teams list.
- Channels details pane: Click the arrow in box icon on the top right to see pinned messages, descriptions, recent changes and more.

Other Microsoft 365 apps
- Coloured folders in OneDrive on File Explorer: The default yellow folder can now be recoloured.
- Copy plan from Planner: Click down arrow by the plan name to copy it.
- Export Planner plans to Excel: Also click the down arrow by the plan name.

- Planner & To Do combined into new Planner experience: This article explains the unified experience and the new options listed above.

Power BI apps
Power BI releases monthly update blogs, here they are for September, October and November. The features below marked with a * must be turned on as preview options via File > Options and settings > Options > Preview settings.
- Enable dark mode: Click Options and settings > Global > Report settings > Personalization.
- Visual calculations enhancements: Now supported in field parameters and combo charts.
- Marker enhancements: Line, scatter and similar plots’ markers can now be customised at series level or individual point. You can also now change shape, rotation, colour and border.
- New card visual small multiple options: This will eventually replace the Multi row Card visual.
- Azure map visual enhancements: Data bound reference layers and path layer (e.g. to track flight paths).
- New Text Slicer visual*: Filter your data by a word or partial word, choose which dimensions are affected by dragging relevant ones into the field list bucket.
- New List Slicer visual*: An update to the existing slicer which will eventually have more customisation but is limited at the moment.
Google Sheets
- Filter by condition in Tables: Examples include Date next week or number above 10 etc. These had been available in general filters for some time but are now available when using the Format > Table feature.
- Third party chips: Asana, Jira & Confluence, Canva, Lucid, Loom, Whimsical, and Zoho Projects have added custom chips, meaning that as you hover a link, it will show a preview and have more capabilities. 3rd party apps can now create their own.
- Ctrl+Alt+T is a new shortcut to create a Table.
- Directly link Connected Sheets to existing Looker queries: No need to start from scratch.
Google Workspace
- Modern video player in Google Drive: Rewind & adjust speed easier.
- Create tabs for doc: On the left, you can put things into sections via tabs.
- Cover images for docs: Insert > Cover Image allows you to upload or search for some.
- New Slides templates: Business, education and collaboration templates via Insert > Templates.
- Rating question in Google Forms: This new question type can be useful.
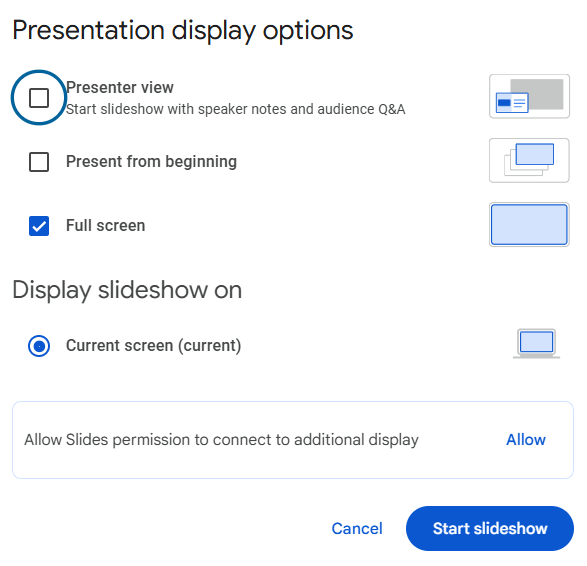
- Presentation display options: Its now easier to choose how to display across monitors.

Google Workspace with Gemini package
- Google Gemini mobile app: Uses AI in various things.
- Gmail polish: Type out short words to get what you want then choose “polish” to get a cleaner way to say the same message.
- Google Vids: AI enabled video creator app can create video from a prompt linked to files.
- Create custom Tables in Sheets based on a prompt.
Zoom
- Enable reminder to turn on AI Companion: Manually enable this setting to get future reminders, but only available for Zoom packages with AI.
- Create or edit polls from Desktop App: No need to go the web portal first.
- New shortcuts for chat: Ctrl N /Cmd N for new chat and Alt+Shift+E/ Shift+Command+E to focus on chat input field.
- Send chat message to multiple chats or channels at the same time.
Canva
Canva had its biggest feature drop of the year in October aptly called Droptober:
- Text to media enhancements*: With Magic Media, you can now create a graphic, sticker, video or image from text prompt, and you can click one you like then > Generate more like this. Generate more advanced pictures with www.canva.com/dream-lab.
- Docs enhancements to be more visual: Set item to be banner and add highlight blocks or dropdowns.
- Embed links: Click on a link, then pencil icon then choose Embed.
- New gallery of inclusive stock images & templates: pocstock has tonnes of templates built in.
- Enhancements to magic write: After the first attempt, you can choose “keep writing” or “more like this” or “This but” where you can then say succinct, informal etc.
- Add polls and quizzes to presentations that users can vote for.
- Six new animations for presentations and video.
- New & interactive charts: Racing bar charts are nice, but I still find it’s much harder to manage data for charts here than on spreadsheets.
- Auto add captions to videos and keep with branded fonts and colours.
- Whiteboard enhancements: Sort post it notes, and emoji react to comments.
That wraps up the updates until November 2024, come back for more new features in March 2025.
- Excel, Teams, Google Sheets, Chat GPT, M365, Power BI, Canva, Zoom ++: New tech features for Mar-May 2025
- Excel, Teams, Power BI, Canva, Zoom, Google Sheets++: New tech features for Sep-Dec 2024
- Excel, Teams, Power BI, Canva, Zoom, Google Sheets++: New tech features for Jun-Aug 2024
- New tech features for Mar-May 2024
- New tech features for Nov-Feb 2024
Archive and Knowledge Base
This archive of Excel Community content from the ION platform will allow you to read the content of the articles but the functionality on the pages is limited. The ION search box, tags and navigation buttons on the archived pages will not work. Pages will load more slowly than a live website. You may be able to follow links to other articles but if this does not work, please return to the archive search. You can also search our Knowledge Base for access to all articles, new and archived, organised by topic.

